| 1st constituency of Eure-et-Loir | |
|---|---|
inline National Assembly of France | |
 constituency in department | |
 | |
| Deputy | |
| Department | Eure-et-Loir |
| Cantons | Chartres Nord-Est, Chartres Sud-Est, Chartres Sud-Ouest, Maintenon, Nogent-le-Roi |
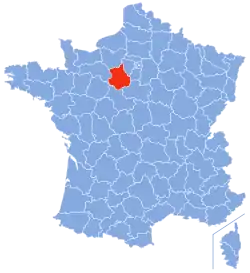
The 1st constituency of Eure-et-Loir is a French legislative constituency in the Eure-et-Loir département.
It is based in the city of Chartres.
Assembly Members
| Election | Member | Party | |
|---|---|---|---|
| 1988 | Georges Lemoine | PS | |
| 1993 | Gérard Cornu | RPR | |
| 1997 | Georges Lemoine | PS | |
| 2002 | Jean-Pierre Gorges | UMP | |
| 2007 | |||
| 2008 | Françoise Vallet | PS | |
| 2008 | Jean-Pierre Gorges | UMP | |
| 2012 | |||
| 2017 | Guillaume Kasbarian | LREM | |
| 2022 | RE | ||
Election results
2022
| Party | Candidate | Votes | % | ±% | |
|---|---|---|---|---|---|
| LREM (Ensemble) | Guillaume Kasbarian | 10,087 | 31.32 | -5.80 | |
| EELV (NUPÉS) | Quentin Guillemain | 8,370 | 22.83 | +3.96 | |
| RN | David Delorme-Monsarrat | 8,270 | 18.72 | +5.98 | |
| LR (UDC) | Ladislas Vergne | 3,892 | 8.81 | -13.34 | |
| LR | Karine Dorange* | 3,706 | 8.39 | N/A | |
| REC | Cyril Hemardinquer | 2,083 | 4.71 | N/A | |
| PA | Pierre Mazaheri | 1,040 | 2.35 | +0.57 | |
| The Patriots (UPF) | Lucien Maillet | 707 | 1.60 | -0.29 | |
| LO | Marie-José Aubert | 557 | 1.26 | +0.47 | |
| Turnout | 44,180 | 49.32 | -1.82 | ||
| 2nd round result | |||||
| LREM (Ensemble) | Guillaume Kasbarian | 22,530 | 58.10 | +2.92 | |
| EELV (NUPÉS) | Quentin Guillemain | 16,251 | 41.90 | N/A | |
| Turnout | 38,781 | 46.44 | +2.98 | ||
| LREM hold | |||||
2017
| Candidate | Label | First round | Second round | |||
|---|---|---|---|---|---|---|
| Votes | % | Votes | % | |||
| Guillaume Kasbarian | REM | 16,577 | 37.12 | 19,127 | 55.18 | |
| Franck Masselus | LR | 9,892 | 22.15 | 15,534 | 44.82 | |
| Sylvie Rouxel | FN | 5,688 | 12.74 | |||
| Julien Morainnes | FI | 4,608 | 10.32 | |||
| Stéphane Cordier | PS | 2,921 | 6.54 | |||
| Michel Teilleux | DVD | 1,258 | 2.82 | |||
| Hugues Villemade | PCF | 896 | 2.01 | |||
| Régine Lemoine | DLF | 843 | 1.89 | |||
| Pierre Mazaheri | ECO | 794 | 1.78 | |||
| Marie-José Aubert | EXG | 352 | 0.79 | |||
| Clément Dumons | DIV | 336 | 0.75 | |||
| Stéphanie Gaidou | EXD | 263 | 0.59 | |||
| Noé Common | DIV | 145 | 0.32 | |||
| Thibaut Brière-Saunier | DVD | 83 | 0.19 | |||
| Valérie Caillol | DVD | 0 | 0.00 | |||
| Votes | 44,656 | 100.00 | 34,661 | 100.00 | ||
| Valid votes | 44,656 | 97.96 | 34,661 | 89.49 | ||
| Blank votes | 673 | 1.48 | 3,096 | 7.99 | ||
| Null votes | 255 | 0.56 | 976 | 2.52 | ||
| Turnout | 45,584 | 51.14 | 38,733 | 43.46 | ||
| Abstentions | 43,558 | 48.86 | 50,398 | 56.54 | ||
| Registered voters | 89,142 | 89,131 | ||||
| Source: Ministry of the Interior | ||||||
2012
| Candidate | Party | First round | Second round | ||||||||
|---|---|---|---|---|---|---|---|---|---|---|---|
| Votes | % | Votes | % | ||||||||
| Jean-Pierre Gorges | UMP | 19,562 | 38.61% | 25,830 | 50.80% | ||||||
| David Lebon | PS | 19,444 | 38.38% | 25,032 | 49.23% | ||||||
| Nathalie Grenier | FN | 7,283 | 14.37% | ||||||||
| Ingrid Lescarbotte | FG | 2,128 | 4.20% | ||||||||
| Antoine Chassaing | AEI | 730 | 1.44% | ||||||||
| Adrien Chevalier | DVD (UPF) | 582 | 1.15% | ||||||||
| Adeline El-Idrissi | DLR | 428 | 0.84% | ||||||||
| Marie-José Aubert | LO | 287 | 0.57% | ||||||||
| Mélinée Treppoz | NPA | 183 | 0.36% | ||||||||
| Thibaut Briere-Saunier | AR | 39 | 0.08% | ||||||||
| Valid votes | 50,666 | 98.50% | 50,842 | 97.15% | |||||||
| Spoilt and null votes | 770 | 1.50% | 1,490 | 2.85% | |||||||
| Votes cast / turnout | 51,436 | 58.92% | 52,332 | 59.94% | |||||||
| Abstentions | 35,865 | 41.08% | 34,971 | 40.06% | |||||||
| Registered voters | 87,301 | 100.00% | 87,303 | 100.00% | |||||||
September 2008
| Party | Candidate | Votes | % | ±% | |
|---|---|---|---|---|---|
| UMP | Jean-Pierre Gorges | 13,885 | 50.94 | ||
| PS | David Lebon | 13,370 | 49.06 | ||
| Turnout | 27,255 | 33.11 | |||
| UMP gain from PS | Swing | ||||
January–February 2008
| Party | Candidate | Votes | % | ±% | |
|---|---|---|---|---|---|
| PS | Françoise Vallet | 20,946 | 55.26 | ||
| UMP | Jean-Pierre Gorges | 16,958 | 44.74 | ||
| Turnout | 37,904 | 45.85 | |||
| PS gain from UMP | Swing | ||||
2007
| Party | Candidate | Votes | % | ±% | |
|---|---|---|---|---|---|
| UMP | Jean-Pierre Gorges | 23,556 | 50.06 | ||
| PS | Françoise Vallet | 23,497 | 49.94 | ||
| Turnout | 47,053 | 57.67 | |||
| UMP hold | Swing | ||||
References
- ↑ "Résultats des élections législatives 2022 dans l'Eure-et-Loir". Le Monde.fr (in French). Retrieved 7 July 2022.
Sources
- Official results of French elections from 1998: "Résultats électoraux officiels en France" (in French). Archived from the original on 20 December 2011. Retrieved 4 May 2009.
This article is issued from Wikipedia. The text is licensed under Creative Commons - Attribution - Sharealike. Additional terms may apply for the media files.