| Kasaragod | |
|---|---|
| Lok Sabha constituency | |
 Map of Kasaragod Parliament Constituency | |
| Constituency details | |
| Country | India |
| Region | South India |
| State | Kerala |
| Assembly constituencies | Manjeshwar Kasaragod Udma Kanhangad Trikaripur Payyanur Kalliasseri |
| Established | 1957 |
| Total electors | 13,60,827 (2019) |
| Reservation | None |
| Member of Parliament | |
| 17th Lok Sabha | |
| Incumbent | |
| Party | INC |
| Elected year | 2019 |
Kasaragod (Casrod) Lok Sabha constituency (Malayalam: കാസർഗോഡ് ലോക്സഭാ മണ്ഡലം) is one of the 20 Lok Sabha (parliamentary) constituencies in Kerala state in southern India.
Assembly segments
Kasaragod Lok Sabha constituency is composed of the following assembly segments:[1]
Members of Parliament
Most Successful parties from Kasaragod Lok Sabha
Election results
General Elections 2019
| Party | Candidate | Votes | % | ±% | |
|---|---|---|---|---|---|
| INC | Rajmohan Unnithan | 474,961 | 43.50% | 4.70% | |
| CPI(M) | K. P. Satheesh Chandran | 4,34,523 | 39.80% | 0.29% | |
| BJP | Ravisha Thanthri Kuntar | 1,76,049 | 16.13% | -1.61% | |
| Margin of victory | 40,438 | 3.70% | 2.99% | ||
| Turnout | 10,91,752 | 80.66% | 1.71% | ||
| Registered electors | 13,63,937 | 9.67% | |||
| INC gain from CPI(M) | Swing | 3.99% | |||
General Elections 2014
| Party | Candidate | Votes | % | ±% | |
|---|---|---|---|---|---|
| CPI(M) | P. Karunakaran | 384,964 | 39.52% | -6.00% | |
| INC | T. Siddique | 3,78,043 | 38.80% | 0.90% | |
| BJP | K. Surendran | 1,72,826 | 17.74% | 2.93% | |
| SDPI | N. U. Abdul Salam | 9,713 | 1.00% | ||
| NOTA | None of the Above | 6,103 | 0.63% | ||
| AAP | Ambalathara Kunhikrishnan | 4,996 | 0.51% | ||
| Margin of victory | 6,921 | 0.71% | -6.90% | ||
| Turnout | 9,74,215 | 78.41% | 2.28% | ||
| Registered electors | 12,43,730 | 11.66% | |||
| CPI(M) hold | Swing | -6.00% | |||
General Elections 2009
| Party | Candidate | Votes | % | ±% | |
|---|---|---|---|---|---|
| CPI(M) | P. Karunakaran | 385,522 | 45.51% | -2.99% | |
| INC | Shahida Kamal | 3,21,095 | 37.91% | 1.41% | |
| BJP | K. Surendran | 1,25,482 | 14.81% | 2.58% | |
| BSP | K. H. Madhavi | 5,518 | 0.65% | -0.01% | |
| Independent | P. K. Raman | 5,008 | 0.59% | ||
| Margin of victory | 64,427 | 7.61% | -4.40% | ||
| Turnout | 8,47,096 | 76.15% | -1.67% | ||
| Registered electors | 11,13,892 | -3.99% | |||
| CPI(M) hold | Swing | -2.99% | |||
General Elections 2004
| Party | Candidate | Votes | % | ±% | |
|---|---|---|---|---|---|
| CPI(M) | P. Karunakaran | 437,284 | 48.50% | 2.73% | |
| INC | N. A. Mohammed | 3,29,028 | 36.49% | -5.87% | |
| BJP | V. Balakrishna Shetty | 1,10,328 | 12.24% | 1.22% | |
| Independent | P. Sivanandan | 7,726 | 0.86% | ||
| BSP | Sukumaran | 5,947 | 0.66% | ||
| Independent | M. A. Mohammed | 4,652 | 0.52% | ||
| Margin of victory | 1,08,256 | 12.01% | 8.59% | ||
| Turnout | 9,01,603 | 77.77% | 0.08% | ||
| Registered electors | 11,60,134 | -3.32% | |||
| CPI(M) hold | Swing | 2.73% | |||
General Elections 1999
| Party | Candidate | Votes | % | ±% | |
|---|---|---|---|---|---|
| CPI(M) | T. Govindan | 423,564 | 45.77% | 0.08% | |
| INC | Khader Mangad | 3,91,986 | 42.36% | 2.24% | |
| BJP | P. K. Krishna Das | 1,01,934 | 11.02% | -0.88% | |
| Margin of victory | 31,578 | 3.41% | -2.15% | ||
| Turnout | 9,25,384 | 77.64% | 5.09% | ||
| Registered electors | 11,99,964 | 5.16% | |||
| CPI(M) hold | Swing | -0.85% | |||
General Elections 1998
| Party | Candidate | Votes | % | ±% | |
|---|---|---|---|---|---|
| CPI(M) | T. Govindan | 395,910 | 45.69% | -0.94% | |
| INC | Khader Mangad | 3,47,670 | 40.12% | 2.86% | |
| BJP | P. K. Krishna Das | 1,03,093 | 11.90% | -0.33% | |
| INL | N. A. Nellikunnu | 17,736 | 2.05% | ||
| Margin of victory | 48,240 | 5.57% | -3.80% | ||
| Turnout | 8,66,525 | 76.41% | 3.86% | ||
| Registered electors | 11,41,067 | 1.91% | |||
| CPI(M) hold | Swing | -0.94% | |||
General Elections 1996
| Party | Candidate | Votes | % | ±% | |
|---|---|---|---|---|---|
| CPI(M) | T. Govindan | 371,997 | 46.63% | 1.81% | |
| INC | Ramanna Rai | 2,97,267 | 37.26% | -6.33% | |
| BJP | P. K. Krishnadas | 97,577 | 12.23% | 2.34% | |
| Independent | T. M. Kunhi | 4,446 | 0.56% | ||
| Independent | B. K. Ahammed Kunhi | 4,155 | 0.52% | ||
| Margin of victory | 74,730 | 9.37% | 8.14% | ||
| Turnout | 7,97,847 | 72.55% | -2.23% | ||
| Registered electors | 11,19,715 | 7.99% | |||
| CPI(M) hold | Swing | 1.81% | |||
General Elections 1991
| Party | Candidate | Votes | % | ±% | |
|---|---|---|---|---|---|
| CPI(M) | Ramanna Rai | 344,536 | 44.82% | -0.18% | |
| INC | K. C. Venugopal | 3,35,113 | 43.59% | -1.21% | |
| BJP | C. K. Padmanabhan | 76,067 | 9.89% | 1.19% | |
| Independent | L. Ismail | 3,590 | 0.47% | ||
| Margin of victory | 9,423 | 1.23% | 1.03% | ||
| Turnout | 7,68,757 | 74.78% | -4.67% | ||
| Registered electors | 10,36,913 | 2.64% | |||
| CPI(M) hold | Swing | -0.18% | |||
General Elections 1989
| Party | Candidate | Votes | % | ±% | |
|---|---|---|---|---|---|
| CPI(M) | Ramanna Rai | 358,723 | 44.99% | 1.42% | |
| INC | I. Rama Rai | 3,57,177 | 44.80% | -0.74% | |
| BJP | C. K. Padmanabhan | 69,419 | 8.71% | -1.52% | |
| Margin of victory | 1,546 | 0.19% | -1.78% | ||
| Turnout | 7,97,296 | 79.46% | 1.28% | ||
| Registered electors | 10,10,280 | 35.57% | |||
| CPI(M) gain from INC | Swing | -0.55% | |||
General Elections 1984
| Party | Candidate | Votes | % | ±% | |
|---|---|---|---|---|---|
| INC | I. Rama Rai | 262,904 | 45.54% | ||
| CPI(M) | Balanandan | 2,51,535 | 43.57% | -13.38% | |
| BJP | K. G. Marar | 59,021 | 10.22% | ||
| Independent | N. M. Mohamood | 2,787 | 0.48% | ||
| Margin of victory | 11,369 | 1.97% | -13.92% | ||
| Turnout | 5,77,331 | 78.17% | 9.35% | ||
| Registered electors | 7,45,222 | 9.84% | |||
| INC gain from CPI(M) | Swing | -11.41% | |||
General Elections 1980
| Party | Candidate | Votes | % | ±% | |
|---|---|---|---|---|---|
| CPI(M) | Ramanna Rai | 263,673 | 56.95% | 7.51% | |
| JP | O. Rajagopal | 1,90,086 | 41.05% | ||
| Independent | Pattathil Raghavan | 4,360 | 0.94% | ||
| Independent | M. A. Abdulla Mallath | 2,492 | 0.54% | ||
| Independent | K. V. Balakrishnan | 2,415 | 0.52% | ||
| Margin of victory | 73,587 | 15.89% | 14.77% | ||
| Turnout | 4,63,026 | 68.83% | -11.19% | ||
| Registered electors | 6,78,476 | 17.29% | |||
| CPI(M) gain from INC | Swing | 6.38% | |||
General Elections 1977
| Party | Candidate | Votes | % | ±% | |
|---|---|---|---|---|---|
| INC | Ramachandran Kadannappalli | 227,305 | 50.56% | 4.58% | |
| CPI(M) | M. Ramanna Rai | 2,22,263 | 49.44% | 10.35% | |
| Margin of victory | 5,042 | 1.12% | -5.77% | ||
| Turnout | 4,49,568 | 80.02% | 8.23% | ||
| Registered electors | 5,78,474 | -0.11% | |||
| INC hold | Swing | 4.58% | |||
General Elections 1971
| Party | Candidate | Votes | % | ±% | |
|---|---|---|---|---|---|
| INC | Ramachandran Kadannappalli | 189,486 | 45.98% | 19.80% | |
| CPI(M) | E. K. Nayanar | 1,61,082 | 39.09% | -22.38% | |
| ABJS | U. Ishwara Bhat | 43,564 | 10.57% | ||
| Independent | Pattathil Raghavan | 17,930 | 4.35% | ||
| Margin of victory | 28,404 | 6.89% | -28.39% | ||
| Turnout | 4,12,062 | 71.79% | -3.33% | ||
| Registered electors | 5,79,127 | 23.91% | |||
| INC gain from CPI(M) | Swing | -15.48% | |||
General Elections 1967
| Party | Candidate | Votes | % | ±% | |
|---|---|---|---|---|---|
| CPI(M) | A. K. Gopalan | 206,480 | 61.47% | ||
| INC | T. V. C. Nair | 87,970 | 26.19% | ||
| ABJS | M. U. Rao | 41,471 | 12.35% | ||
| Margin of victory | 1,18,510 | 35.28% | 7.77% | ||
| Turnout | 3,35,921 | 75.12% | 8.12% | ||
| Registered electors | 4,67,371 | 1.52% | |||
| CPI(M) gain from CPI | Swing | -0.70% | |||
General Elections 1962
| Party | Candidate | Votes | % | ±% | |
|---|---|---|---|---|---|
| CPI | A. K. Gopalan | 188,384 | 62.17% | 11.15% | |
| PSP | K. R. Karanth | 1,05,021 | 34.66% | ||
| ABJS | Govinda Menoki Illath | 6,816 | 2.25% | ||
| Independent | C. V. Ebrayan | 2,806 | 0.93% | ||
| Margin of victory | 83,363 | 27.51% | 25.47% | ||
| Turnout | 3,03,027 | 67.00% | 10.80% | ||
| Registered electors | 4,60,358 | 2.46% | |||
| CPI hold | Swing | 11.15% | |||
General Elections 1957
| Party | Candidate | Votes | % | ±% | |
|---|---|---|---|---|---|
| CPI | A. K. Gopalan | 128,839 | 51.02% | ||
| Independent | B. Achutha Shenoy | 1,23,694 | 48.98% | ||
| Margin of victory | 5,145 | 2.04% | |||
| Turnout | 2,52,533 | 56.21% | |||
| Registered electors | 4,49,300 | ||||
| CPI win (new seat) | |||||
See also
References
- ↑ "Assembly Constituencies - Corresponding Districts and Parliamentary Constituencies" (PDF). Kerala. Election Commission of India. Archived from the original (PDF) on 4 March 2009. Retrieved 18 October 2008.
External links
- Election Commission of India: http://www.eci.gov.in/StatisticalReports/ElectionStatistics.asp]
- 2019 Kasaragod Lok Sabha Constituency Election Results and Candidates List
- Kasaragod Lok Sabha Elections Asianet News survey results 2019
Lok Sabha constituencies of Kerala | ||
|---|---|---|
| Current | 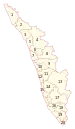 | |
| Defunct |
| |
This article is issued from Wikipedia. The text is licensed under Creative Commons - Attribution - Sharealike. Additional terms may apply for the media files.