2024 U.S. presidential election | |
|---|---|
| Democratic Party | |
| Republican Party | |
|
|
| Third parties | |
| Related races | |
| |
This is a list of nationwide public opinion polls that have been conducted relating to the Republican primaries for the 2024 United States presidential election. The persons named in the polls are declared candidates or have received media speculation about their possible candidacy. The polls included are among Republicans or Republicans and Republican-leaning independents. If multiple versions of polls are provided, the version among likely voters is prioritized, then registered voters, then adults.
Background

| Active campaign | Exploratory committee | Withdrawn candidate | Republican National Convention | ||||
| Midterm elections | Debates | Primaries |
In December 2023, the Colorado Supreme Court rejected the presidential eligibility of Donald Trump, the former president of the United States and a candidate in the 2024 presidential election, on the basis of his actions during the January 6 Capitol attack. The Colorado Supreme Court held that Trump's actions before and during the attack constituted engaging in insurrection; the Fourteenth Amendment disqualifies presidential candidates who have engaged in insurrection against the United States.
The Colorado Supreme Court's ruling in Anderson v. Griswold is the first time that a presidential candidate has been disqualified from office in a state on the basis of the Fourteenth Amendment. It is stayed until a ruling is made by the Supreme Court of the United States. On January 5, 2024, the U.S. Supreme Court granted a writ of certiorari for Trump's appeal of the Colorado Supreme Court ruling in Anderson v. Griswold and scheduled oral arguments for February 8. The 2024 Colorado Republican presidential primary is currently scheduled for March 5.
Nationwide polling

Aggregate polls
| Source of poll aggregation |
Dates administered |
Dates updated |
Ron DeSantis |
Nikki Haley |
Asa Hutchinson |
Vivek Ramaswamy |
Donald Trump |
Other/ Undecided[lower-alpha 1] |
Margin |
|---|---|---|---|---|---|---|---|---|---|
| 270 to Win | January 2–12, 2024 | January 14, 2024 | 11.8% | 11.6% | 0.7% | 5.2% | 65.0% | 5.7% | Trump +53.2% |
| Decision Desk HQ/The Hill | through January 9, 2024 | January 12, 2024 | 11.1% | 11.8% | – | 4.7% | 62.7% | 9.7% | Trump +50.9% |
| FiveThirtyEight | through January 9, 2024 | January 12, 2024 | 12.1% | 11.7% | 0.9% | 4.3% | 60.4% | 10.6% | Trump +48.3% |
| Race to the WH | through January 9, 2024 | January 12, 2024 | 11.4% | 11.3% | 0.9% | 5.1% | 60.4% | 10.9% | Trump +49.0% |
| Real Clear Polling | December 19, 2023 – January 12, 2024 | January 14, 2024 | 11.0% | 11.9% | 0.7% | 4.3% | 60.9% | 11.2% | Trump +49.0% |
| Average | 11.5% | 11.7% | 0.8% | 4.7% | 61.9% | 9.4% | Trump +50.2% | ||
Individual polls
| Poll source | Date(s) administered | Sample size[lower-alpha 2] | Doug Burgum |
Chris Christie |
Ron DeSantis |
Larry Elder |
Nikki Haley |
Asa Hutchinson |
Mike Pence |
Vivek Ramaswamy |
Tim Scott |
Donald Trump |
Other/ Undecided |
|---|---|---|---|---|---|---|---|---|---|---|---|---|---|
| Iowa caucuses held. Vivek Ramaswamy suspends his campaign. | |||||||||||||
| CBS News | January 10–12, 2024 | 721 (LV) | – | – | 14% | – | 12% | 1% | – | 4% | – | 69% | – |
| Chris Christie suspends his campaign. Fifth debate held. | |||||||||||||
| Economist/YouGov | January 7–9, 2024 | 533 (LV) | – | 1% | 10% | – | 12% | 0% | – | 5% | – | 65% | 7%[lower-alpha 3] |
| Ipsos/Reuters | January 3–9, 2024 | 1,941 (A) | – | 2% | 11% | – | 12% | – | – | 4% | – | 49% | 22%[lower-alpha 4] |
| Morning Consult | January 5–7, 2024 | 3,982 (LV) | – | 4% | 13% | – | 11% | 1% | – | 5% | – | 65% | – |
| I&I/TIPP | January 3–5, 2024 | 497 (LV) | – | – | 10% | – | 10% | – | – | 5% | – | 65% | 8%[lower-alpha 5] |
| Noble Predictive Insights | January 2–4, 2024 | 1,068 (LV) | – | 2% | 12% | – | 13% | 1% | – | 7% | – | 61% | 5%[lower-alpha 6] |
| YouGov/The Economist | December 31, 2023 – January 2, 2024 | 529 (RV) | – | 1% | 14% | – | 8% | 0% | – | 5% | – | 63% | 8%[lower-alpha 7] |
| USA Today/Suffolk | December 26–29, 2023 | 325 (RV) | – | 4% | 10% | – | 13% | – | – | 6% | – | 62% | 5% |
| After a ruling by the Secretary of State of Maine Shenna Bellows, Maine became the second state to disqualify former President Donald Trump from its primary ballot under Section 3 of the 14th Amendment. Trump will remain on the ballot pending a U.S. Supreme Court ruling in Trump v. Anderson. | |||||||||||||
| Rasmussen | December 19–21, 2023 | 792 (LV) | – | 9% | 9% | – | 13% | – | – | 1% | – | 51% | 16% |
| After a ruling by the Colorado Supreme Court, Colorado became the first state to disqualify former President Donald Trump from its primary ballot under Section 3 of the 14th Amendment. Trump will remain on the ballot pending a U.S. Supreme Court ruling in Trump v. Anderson. | |||||||||||||
| McLaughlin & Associates | December 13–19, 2023 | 454 (LV) | – | 4% | 11% | – | 10% | 2% | – | 4% | – | 62% | 8%[lower-alpha 8] |
| YouGov/The Economist | December 16–18, 2023 | 544 (RV) | – | 3% | 17% | – | 10% | 0% | – | 4% | – | 60% | 8%[lower-alpha 9] |
| Quinnipiac University | December 14–18, 2023 | 702 (RV) | – | 3% | 11% | – | 11% | 0% | – | 4% | – | 67% | 3%[lower-alpha 10] |
| YouGov/Yahoo News | December 14–18, 2023 | 446 (RV) | – | 1% | 15% | – | 10% | 1% | – | 3% | – | 56% | 14%[lower-alpha 11] |
| Echelon Insights | December 12–16, 2023 | 443 (LV) | – | 1% | 9% | – | 10% | 0% | – | 5% | – | 70% | 5%[lower-alpha 12] |
| CBS News | December 8–15, 2023 | 378 (LV) | – | 3% | 22% | – | 13% | 0% | – | 4% | – | 58% | – |
| HarrisX/Harris Poll | December 13–14, 2023 | – | – | 3% | 11% | – | 10% | – | – | 3% | – | 67% | 6%[lower-alpha 13] |
| Fox News/Beacon Research | December 10–13, 2023 | 402 (LV) | – | 2% | 12% | – | 9% | 1% | – | 5% | – | 69% | – |
| YouGov/The Economist | December 9–12, 2023 | 557 (A) | – | 3% | 11% | – | 10% | 0% | – | 4% | – | 61% | 11%[lower-alpha 14] |
| Monmouth University/Washington Post | December 5–11, 2023 | 606 (LV) | – | 5% | 13% | – | 13% | 0% | – | 3% | – | 63% | 4% |
| Reuters/Ipsos | December 5–11, 2023 | 1,689 (RV) | – | 2% | 11% | – | 11% | – | – | 5% | – | 61% | 10% |
| Fourth debate held. | |||||||||||||
| Emerson College | December 4–6, 2023 | 466 (LV) | – | 3.7% | 6.7% | – | 13.9% | 1.9% | – | 4.0% | – | 63.8% | 6.0% |
| SSRS/CNN | November 29 – December 6, 2023 | 618 (LV) | 1% | 6% | 15% | – | 13% | 1% | – | 4% | – | 58% | 4%[lower-alpha 15] |
| Doug Burgum suspends his campaign. | |||||||||||||
| Monmouth University | November 30 – December 4, 2023 | 540 (RV) | 1% | 2% | 18% | – | 12% | 0% | – | 4% | – | 58% | 5%[lower-alpha 16] |
| The Wall Street Journal | November 29 – December 4, 2023 | 419 (RV) | 0% | 2% | 14% | – | 15% | 0% | – | 4% | – | 59% | 6% |
| Morning Consult | December 1–3, 2023 | 3,526 (LV) | 0% | 3% | 13% | – | 10% | 0% | – | 6% | – | 66% | 2%[lower-alpha 17] |
| Pew Research Center | November 27 – December 3, 2023 | 1,901 (RV) | – | 1% | 14% | – | 11% | – | – | 3% | – | 52% | 18% |
| Big Village | November 27 – December 3, 2023 | 861 (LV) | – | 1.8% | 11.6% | – | 10.2% | 0.5% | – | 5.8% | 0.0% | 67.2% | 2.6%[lower-alpha 18] |
| Trafalgar Group | November 30 – December 2, 2023 | 1,044 (RV) | 0.4% | 6.3% | 16.7% | – | 16.2% | 0.9% | – | 4.3% | – | 53.5% | 1.8% |
| TIPP/I&I | November 29 – December 1, 2023 | 567 (RV) | 1% | 1% | 9% | – | 10% | 1% | – | 7% | – | 61% | 13%[lower-alpha 19] |
| HarrisX/The Messenger | November 22–28, 2023 | 1,454 (RV) | 1% | 1% | 9% | – | 7% | 0% | – | 4% | – | 68% | 9%[lower-alpha 20] |
| NewsNation | November 26–27, 2023 | – | 0.7% | 3.4% | 10.8% | – | 10.1% | 0.2% | – | 6.2% | – | 60.0% | 8.7%[lower-alpha 21] |
| Leger/The Canadian Press | November 24–26, 2023 | 285 (RV) | – | 2% | 12% | – | 8% | 1% | – | 6% | – | 56% | 15%[lower-alpha 22] |
| Morning Consult | November 24–26, 2023 | 3,944 (LV) | 1% | 3% | 14% | – | 10% | 1% | – | 6% | – | 64% | 1%[lower-alpha 23] |
| Emerson College | November 17–20, 2023 | 662 (LV) | 1.1% | 2.7% | 7.9% | – | 8.5% | 1.3% | – | 5.2% | – | 63.6% | 9.7%[lower-alpha 24] |
| McLaughlin & Associates | November 16–20, 2023 | 453 (LV) | 1% | 4% | 11% | – | 8% | 1% | – | 8% | – | 58% | 9%[lower-alpha 25] |
| Morning Consult | November 15–19, 2023 | 3,619 (LV) | 1% | 3% | 13% | – | 9% | 1% | – | 7% | – | 66% | 0% |
| HarrisX/The Messenger | November 15–19, 2023 | 1,100 (RV) | 1% | 2% | 11% | – | 10% | 0% | – | 4% | – | 62% | 9%[lower-alpha 26] |
| Echelon Insights | November 14–17, 2023 | 461 (LV) | 0% | 1% | 12% | – | 12% | 1% | – | 8% | – | 61% | 5% |
| Harvard-Harris | November 15–16, 2023 | 2,851 (RV) | 0% | 2% | 11% | 1% | 7% | 0% | 4% | 6% | 2% | 60% | 7%[lower-alpha 27] |
| YouGov/The Economist | November 11–14, 2023 | 546 (RV) | 0% | 0% | 19% | – | 9% | 0% | – | 4% | 3% | 57% | 8%[lower-alpha 28] |
| NBC News | November 10–14, 2023 | 317 (RV) | 1% | 3% | 18% | – | 13% | 1% | – | 3% | 1% | 58% | 3%[lower-alpha 29] |
| Beacon Research/Shaw & Company/Fox News | November 10–13, 2023 | 453 (LV) | – | 3% | 14% | – | 11% | – | – | 7% | – | 62% | 1% |
| YouGov/Yahoo News | November 9–13, 2023 | 454 (RV) | 0% | 2% | 15% | – | 10% | 0% | – | 5% | 2% | 54% | 13%[lower-alpha 30] |
| Quinnipiac University | November 9–13, 2023 | 686 (RV) | 1% | 2% | 16% | – | 9% | – | – | 4% | – | 64% | 3%[lower-alpha 31] |
| Tim Scott suspends his campaign. | |||||||||||||
| Morning Consult | November 10–12, 2023 | 3,681 (LV) | 1% | 2% | 14% | – | 9% | 1% | – | 6% | – | 64% | 1%[lower-alpha 32] |
| Lord Ashcroft Polls | November 1–11, 2023 | 3,245 (LV) | 0% | 1% | 11% | – | 6% | 0% | – | 7% | – | 67% | 7%[lower-alpha 33] |
| Cyngal/Republican Main Street Partnership, Women2Women | November 9–10, 2023 | 801 (LV) | 1% | 5% | 9% | – | 8% | 1% | – | 8% | 1% | 60% | 7% |
| Third debate held. | |||||||||||||
| Marquette University Law School | November 2–7, 2023 | 398 (RV) | 0% | 1% | 12% | – | 12% | – | – | 4% | 2% | 54% | 16%[lower-alpha 34] |
| 356 (LV) | 1% | 0% | 12% | – | 14% | – | – | 4% | 2% | 57% | 11%[lower-alpha 35] | ||
| Morning Consult | November 3–5, 2023 | 3,873 (LV) | 0% | 3% | 15% | – | 8% | 0% | – | 7% | 2% | 63% | 1%[lower-alpha 36] |
| Trafalgar | November 3–5, 2023 | 1,089 (LV) | 2.9% | 5.3% | 13.2% | – | 15.0% | 0.4% | – | 4.0% | 3.7% | 50.1% | 5.4%[lower-alpha 37] |
| Big Village | October 30 – November 5, 2023 | 669 (RV) | – | 2.1% | 11.5% | – | 9.5% | 1.2% | – | 6.3% | 2.3% | 64.2% | 3.3%[lower-alpha 38] |
| YouGov/CBS News | October 31 – November 3, 2023 | 556 (LV) | 1% | 2% | 18% | – | 9% | 0% | – | 5% | 4% | 61% | – |
| SSRS/CNN | October 27 – November 2, 2023 | 608 (RV) | – | 2% | 17% | – | 10% | 1% | – | 4% | 3% | 61% | 3%[lower-alpha 39] |
| Rasmussen | October 26 – November 2, 2023 | 1,344 (LV) | 0% | 5% | 12% | – | 9% | 1% | 3% | 3% | 2% | 50% | – |
| HarrisX/The Messenger | October 30 – November 1, 2023 | 753 (RV) | 1% | 1% | 12% | – | 7% | 1% | – | 6% | 1% | 62% | 8%[lower-alpha 40] |
| YouGov/The Economist | October 28–31, 2023 | 518 (RV) | 0%[lower-alpha 41] | 1% | 17% | – | 8% | 1% | – | 5% | 1% | 56% | 12%[lower-alpha 42] |
| American Pulse Research & Polling | October 27–30, 2023 | 257 (LV) | 0.3% | 1.7% | 12.1% | – | 9.8% | – | – | 3.6% | 1.2% | 61.0% | 10.5%[lower-alpha 43] |
| Quinnipiac | October 26–30, 2023 | 666 (RV) | 1% | 3% | 15% | – | 8% | 0% | – | 3% | 3% | 64% | 5%[lower-alpha 44] |
| Leger/The Canadian Press | October 27–29, 2023 | 345 (A) | – | 1% | 15% | – | 5% | 0% | 3% | 2% | 1% | 62% | 11%[lower-alpha 45] |
| Morning Consult | October 27–29, 2023 | 3,912 (LV) | 1% | 3% | 13% | – | 7% | 0% | 5% | 7% | 2% | 61% | 2%[lower-alpha 46] |
| Mike Pence suspends his campaign. | |||||||||||||
| Larry Elder suspends his campaign and endorses Donald Trump. | |||||||||||||
| Echelon Insights | October 23–26, 2023 | 430 (LV) | 0%[lower-alpha 41] | 0% | 12% | 0%[lower-alpha 41] | 7% | 0%[lower-alpha 41] | 3% | 6% | 1% | 62% | 8%[lower-alpha 47] |
| McLaughlin and Associates | October 22–26, 2023 | 449 (LV) | 1% | 3% | 8% | 1% | 8% | 1% | 6% | 7% | 2% | 55% | 11%[lower-alpha 48] |
| Noble Predictive Insights/The Center Square | October 20–26, 2023 | 925 (LV) | 0% | 2% | 13% | 0% | 9% | 0% | 5% | 7% | 2% | 59% | 2%[lower-alpha 49] |
| HarrisX/The Messenger | October 16–23, 2023 | 1,068 (RV) | 1% | 2% | 11% | 0% | 6% | 1% | 4% | 5% | 1% | 61% | 8%[lower-alpha 50] |
| Morning Consult | October 20–22, 2023 | 3,876 (LV) | 0% | 2% | 13% | – | 7% | 1% | 5% | 6% | 2% | 62% | 1%[lower-alpha 51] |
| Perry Johnson suspends his campaign and endorses Donald Trump. | |||||||||||||
| USA Today/Suffolk | October 17–20, 2023 | 309 (RV) | 0.7% | 1.3% | 12.3% | 0.7% | 11.0% | 0.3% | 1.3% | 2.6% | 2.6% | 57.9% | 9.4%[lower-alpha 52] |
| Harvard/HarrisX | October 18–19, 2023 | 768 (RV) | 0% | 2% | 11% | 1% | 7% | 0% | 4% | 6% | 2% | 60% | 7%[lower-alpha 53] |
| Emerson College | October 16–17, 2023 | 728 (RV) | 0.9% | 3.6% | 7.9% | 1.0% | 8.1% | 0.6% | 3.2% | 3.2% | 1.4% | 59.2% | 10.9%[lower-alpha 54] |
| Yahoo News | October 12–16, 2023 | 486 (LV) | 1% | 3% | 16% | 0% | 9% | 0% | 2% | 2% | 1% | 56% | 10%[lower-alpha 55] |
| Premise | October 11–16, 2023 | 661 (A) | – | 1% | 16% | – | 6% | – | 7% | 4% | 1% | 60% | 4%[lower-alpha 56] |
| Zogby Analytics | October 13–15, 2023 | 304 (LV) | – | 3.1% | 9.1% | – | 6.0% | – | 2.6% | 6.0% | 2.3% | 61.9% | 8.9%[lower-alpha 57] |
| Morning Consult | October 13–15, 2023 | 3,600 (LV) | 1% | 3% | 14% | – | 7% | 1% | 6% | 7% | 2% | 59% | 1%[lower-alpha 58] |
| Corey Stapleton suspends his campaign. | |||||||||||||
| Morning Consult | October 10–12, 2023 | 2,476 (LV) | 0% | 3% | 12% | – | 6% | 0% | 5% | 8% | 2% | 63% | – |
| Causeway Solutions | October 9–11, 2023 | 342 (RV) | 1% | 4% | 19% | – | 8% | – | 8% | 6% | 0% | 47% | 7%[lower-alpha 59] |
| Will Hurd suspends his campaign and endorses Nikki Haley. | |||||||||||||
| Fox News | October 6–9, 2023 | 449 (LV) | – | 3% | 13% | – | 10% | – | 4% | 7% | 1% | 59% | 2% |
| CNN/SSRS | October 6–9, 2023 | 428 (LV) | 1% | 2% | 17% | 0% | 8% | 0% | 5% | 4% | 2% | 58% | 2%[lower-alpha 60] |
| Morning Consult | October 6–8, 2023 | 2,476 (LV) | 1% | 3% | 12% | – | 6% | 0% | 5% | 9% | 2% | 61% | 1%[lower-alpha 61] |
| HarrisX/The Messenger | October 4–7, 2023 | 1,054 (RV) | 1% | 2% | 14% | 0% | 6% | 0% | 3% | 7% | 2% | 58% | 5%[lower-alpha 62] |
| Cygnal | October 3–5, 2023 | – | 0.7% | 3.9% | 8.7% | 0.0% | 4.6% | 0.6% | 4.7% | 9.7% | 1.7% | 57.8% | 7.6%[lower-alpha 63] |
| Survey USA | September 30 – October 3, 2023 | 1,055 (LV) | 1% | 3% | 9% | – | 5% | – | 4% | 8% | 2% | 65% | 3%[lower-alpha 64] |
| YouGov/The Economist | September 30 – October 3, 2023 | 570 (RV) | 1% | 1% | 13% | 0% | 7% | 0% | 3% | 4% | 2% | 58% | 11%[lower-alpha 65] |
| Big Village | September 29 – October 3, 2023 | 988 (RV) | 0.3% | 2.0% | 12.9% | 0.2% | 6.4% | 0.7% | 7.0% | 6.9% | 2.5% | 58.4% | 2.5%[lower-alpha 66] |
| Premise | September 28 – October 2, 2023 | 500 (A) | – | 1% | 14% | – | 5% | – | 6% | 5% | 3% | 60% | 6%[lower-alpha 67] |
| Morning Consult | September 29 – October 1, 2023 | 3,587 (LV) | 1% | 3% | 13% | – | 7% | 0% | 5% | 7% | 1% | 61% | 1%[lower-alpha 68] |
| Insider Advantage | September 29–30, 2023 | 850 (LV) | 1% | 5% | 15% | 0% | 14% | 1% | 1% | 3% | 2% | 50% | 8%[lower-alpha 69] |
| WPA Intelligence/FairVote | September 28–30, 2023 | 801 (LV) | 0.4% | 8.5% | 12.7% | 0.3% | 7.7% | 1.1% | 4.4% | 12.6% | 2.8% | 47.6% | 1.9%[lower-alpha 70] |
| HarrisX/The Messenger | September 28–29, 2023 | 770 (RV) | 1% | 1% | 11% | 1% | 7% | 0% | 5% | 8% | 1% | 56% | 6%[lower-alpha 71] |
| TIPP/I&I | September 27–29, 2023 | 584 (RV) | 1% | 2% | 13% | 1% | 4% | 0% | 4% | 6% | 1% | 56% | 11%[lower-alpha 72] |
| Léger/New York Post | September 27–28, 2023 | 495 (LV) | 1% | 0% | 10% | – | 6% | – | 3% | 7% | 3% | 62% | 9%[lower-alpha 73] |
| Echelon Insights | September 25–28, 2023 | 402 (LV) | 0% | 1% | 11% | 0% | 5% | 0% | 5% | 10% | 1% | 62% | 4%[lower-alpha 74] |
| Second debate held. | |||||||||||||
| YouGov/The Economist | September 23–26, 2023 | 559 (A) | 0% | 2% | 12% | 0% | 7% | 0% | 5% | 5% | 3% | 51% | 15%[lower-alpha 75] |
| McLaughlin & Associates | September 22–26, 2023 | 454 (LV) | 1% | 2% | 12% | 0% | 6% | 1% | 5% | 10% | 2% | 54% | 8%[lower-alpha 76] |
| Marquette University Law School | September 18–25, 2023 | 418 (A) | 0% | 0% | 11% | 0% | 6% | 0% | 4% | 4% | 1% | 56% | 16%[lower-alpha 77] |
| Morning Consult | September 22–24, 2023 | 3,552 (LV) | 1% | 2% | 15% | – | 7% | 1% | 6% | 9% | 2% | 58% | 1%[lower-alpha 78] |
| Monmouth University | September 19–24, 2023 | 514 (RV) | 0% | 1% | 15% | – | 6% | 0% | 1% | 4% | 3% | 48% | 23%[lower-alpha 79] |
| Trafalgar Group | September 18–21, 2023 | 1,091 (LV) | 3.2% | 3.2% | 14.3% | 1.3% | 4.2% | 0.4% | 3.8% | 5.9% | 3.0% | 56.1% | 4.5%[lower-alpha 80] |
| ABC News/Washington Post | September 15–20, 2023 | 474 (A) | 0% | 3% | 15% | – | 7% | 0% | 6% | 3% | 4% | 54% | 10%[lower-alpha 81] |
| NBC News | September 15–19, 2023 | 321 (RV) | 0% | 4% | 16% | – | 7% | 1% | 4% | 2% | 3% | 59% | 4%[lower-alpha 82] |
| HarrisX/The Messenger | September 13–19, 2023 | 1,089 (RV) | 1% | 2% | 14% | 1% | 5% | 1% | 3% | 5% | 2% | 56% | 11%[lower-alpha 83] |
| Emerson College | September 17–18, 2023 | 518 (LV) | 1.1% | 4.8% | 11.5% | – | 3.0% | 0.5% | 4.6% | 6.8% | 2.2% | 58.9% | 6.6%[lower-alpha 84] |
| YouGov | September 14–18, 2023 | 470 (RV) | 1% | 1% | 13% | 0% | 5% | 0% | 3% | 5% | 1% | 59% | 11%[lower-alpha 85] |
| YouGov/The Liberal Patriot | September 7–18, 2023 | 1,653 (LV) | 1% | 6% | 14% | 1% | 8% | 1% | 5% | 5% | 4% | 48% | 7%[lower-alpha 86] |
| Morning Consult | September 15–17, 2023 | 3,404 (LV) | 0% | 2% | 13% | – | 6% | 1% | 5% | 10% | 2% | 59% | 1%[lower-alpha 87] |
| Harvard/Harris[upper-alpha 1] | September 13–14, 2023 | 758 (RV) | 0% | 2% | 10% | 1% | 6% | 0% | 4% | 8% | 2% | 57% | 11%[lower-alpha 88] |
| Ipsos/Reuters | September 8–14, 2023 | 1,749 (A) | 0% | 2% | 14% | – | 4% | 0% | 4% | 13% | 2% | 51% | 10%[lower-alpha 89] |
| YouGov/The Economist | September 10–12, 2023 | 572 (A) | 0% | 2% | 14% | 0% | 5% | 0% | 5% | 6% | 3% | 52% | 12%[lower-alpha 90] |
| Fox News | September 9–12, 2023 | 409 (LV) | – | 2% | 13% | – | 5% | – | 3% | 11% | 3% | 60% | 2% |
| Quinnipiac University | September 7–11, 2023 | 728 (RV) | – | 2% | 12% | – | 5% | – | 5% | 6% | 3% | 62% | 4%[lower-alpha 91] |
| HarrisX/The Messenger | September 6–11, 2023 | 954 (RV) | 0% | 2% | 11% | 1% | 4% | 0% | 4% | 7% | 2% | 59% | 10%[lower-alpha 92] |
| Morning Consult | September 8–10, 2023 | 3,715 (LV) | 0% | 3% | 14% | – | 6% | 0% | 6% | 9% | 2% | 57% | 1%[lower-alpha 93] |
| Premise | August 30 – September 5, 2023 | 415 (RV) | – | 1% | 12% | – | 5% | – | 7% | 5% | 2% | 62% | 7%[lower-alpha 94] |
| Rasmussen | August 29 – September 5, 2023 | 1,418 (LV) | 0% | 9% | 9% | 1% | 7% | 0% | 4% | 5% | 4% | 45% | 0%[lower-alpha 95] |
| Redfield & Wilton Strategies | September 3–4, 2023 | 605 (LV) | 0% | 3% | 9% | – | 2% | 1% | 3% | 10% | 1% | 65% | 6%[lower-alpha 96] |
| Morning Consult | September 2–4, 2023 | 3,745 (LV) | 0% | 3% | 15% | – | 5% | 1% | 6% | 8% | 2% | 60% | 1%[lower-alpha 97] |
| I&I/TIPP | August 30 – September 1, 2023 | 509 (RV) | 0.4% | 1% | 11% | 0.87% | 2.8% | 0.4% | 6% | 9% | 1.3% | 60% | 15%[lower-alpha 98] |
| Echelon Insights | August 28–31, 2023 | 397 (LV) | 0% | 3% | 15% | 1% | 4% | 1% | 6% | 12% | 1% | 52% | 6%[lower-alpha 99] |
| SSRS/CNN | August 25–31, 2023 | 784 (RV) | 1% | 2% | 18% | 1% | 7% | 0% | 7% | 6% | 3% | 52% | 2%[lower-alpha 100] |
| Wall Street Journal | August 24–30, 2023 | 600 (LV) | 1% | 3% | 13% | 0% | 8% | 1% | 2% | 5% | 2% | 59% | 4%[lower-alpha 101] |
| Francis Suarez suspends his campaign. | |||||||||||||
| Morning Consult | August 29, 2023 | 3,617 (LV) | 0% | 3% | 14% | – | 5% | 1% | 6% | 10% | 2% | 58% | 1%[lower-alpha 102] |
| YouGov/The Economist | August 26–29, 2023 | 562 (A) | 0% | 2% | 14% | 0% | 4% | 0% | 3% | 5% | 2% | 51% | 18%[lower-alpha 103] |
| FairVote/WPA Intelligence | August 24–28, 2023 | 800 (LV) | 0.7% | 4.8% | 18.5% | 0.0% | 8.5% | 0.5% | 5.7% | 6.9% | 3.6% | 49.3% | 1.4%[lower-alpha 104] |
| HarrisX/The Messenger | August 24–28, 2023 | 685 (RV) | 0% | 2% | 14% | 0% | 3% | 0% | 6% | 8% | 2% | 59% | 6%[lower-alpha 105] |
| Big Village | August 25–27, 2023 | 722 (A) | 0.6% | 1.7% | 14.0% | 0.4% | 5.1% | 0.9% | 6.4% | 8.8% | 1.9% | 56.8% | 3.2%[lower-alpha 106] |
| Emerson College | August 25–26, 2023 | 460 (LV) | 0.6% | 5.2% | 11.6% | – | 6.5% | 0.6% | 6.9% | 8.8% | 1.6% | 49.6% | 8.6%[lower-alpha 107] |
| Ipsos/Reuters | August 24–25, 2023 | 347 (A) | 0% | 1% | 13% | – | 4% | 0% | 6% | 5% | 1% | 52% | 17%[lower-alpha 108] |
| Kaplan Strategies | August 24, 2023 | 844 (LV) | 2% | 4% | 10% | – | 8% | 1% | 5% | 13% | 4% | 45% | 8%[lower-alpha 109] |
| Morning Consult | August 24, 2023 | 1,256 (LV) | 0% | 4% | 14% | – | 3% | 0% | 6% | 11% | 3% | 58% | 1%[lower-alpha 110] |
| Patriot Polling | August 24, 2023 | 750 (RV) | 4.3% | 6.2% | 21.0% | – | 12.6% | 1.0% | 5.4% | 5.1% | 3.5% | 40.6% | 3.8%[lower-alpha 111] |
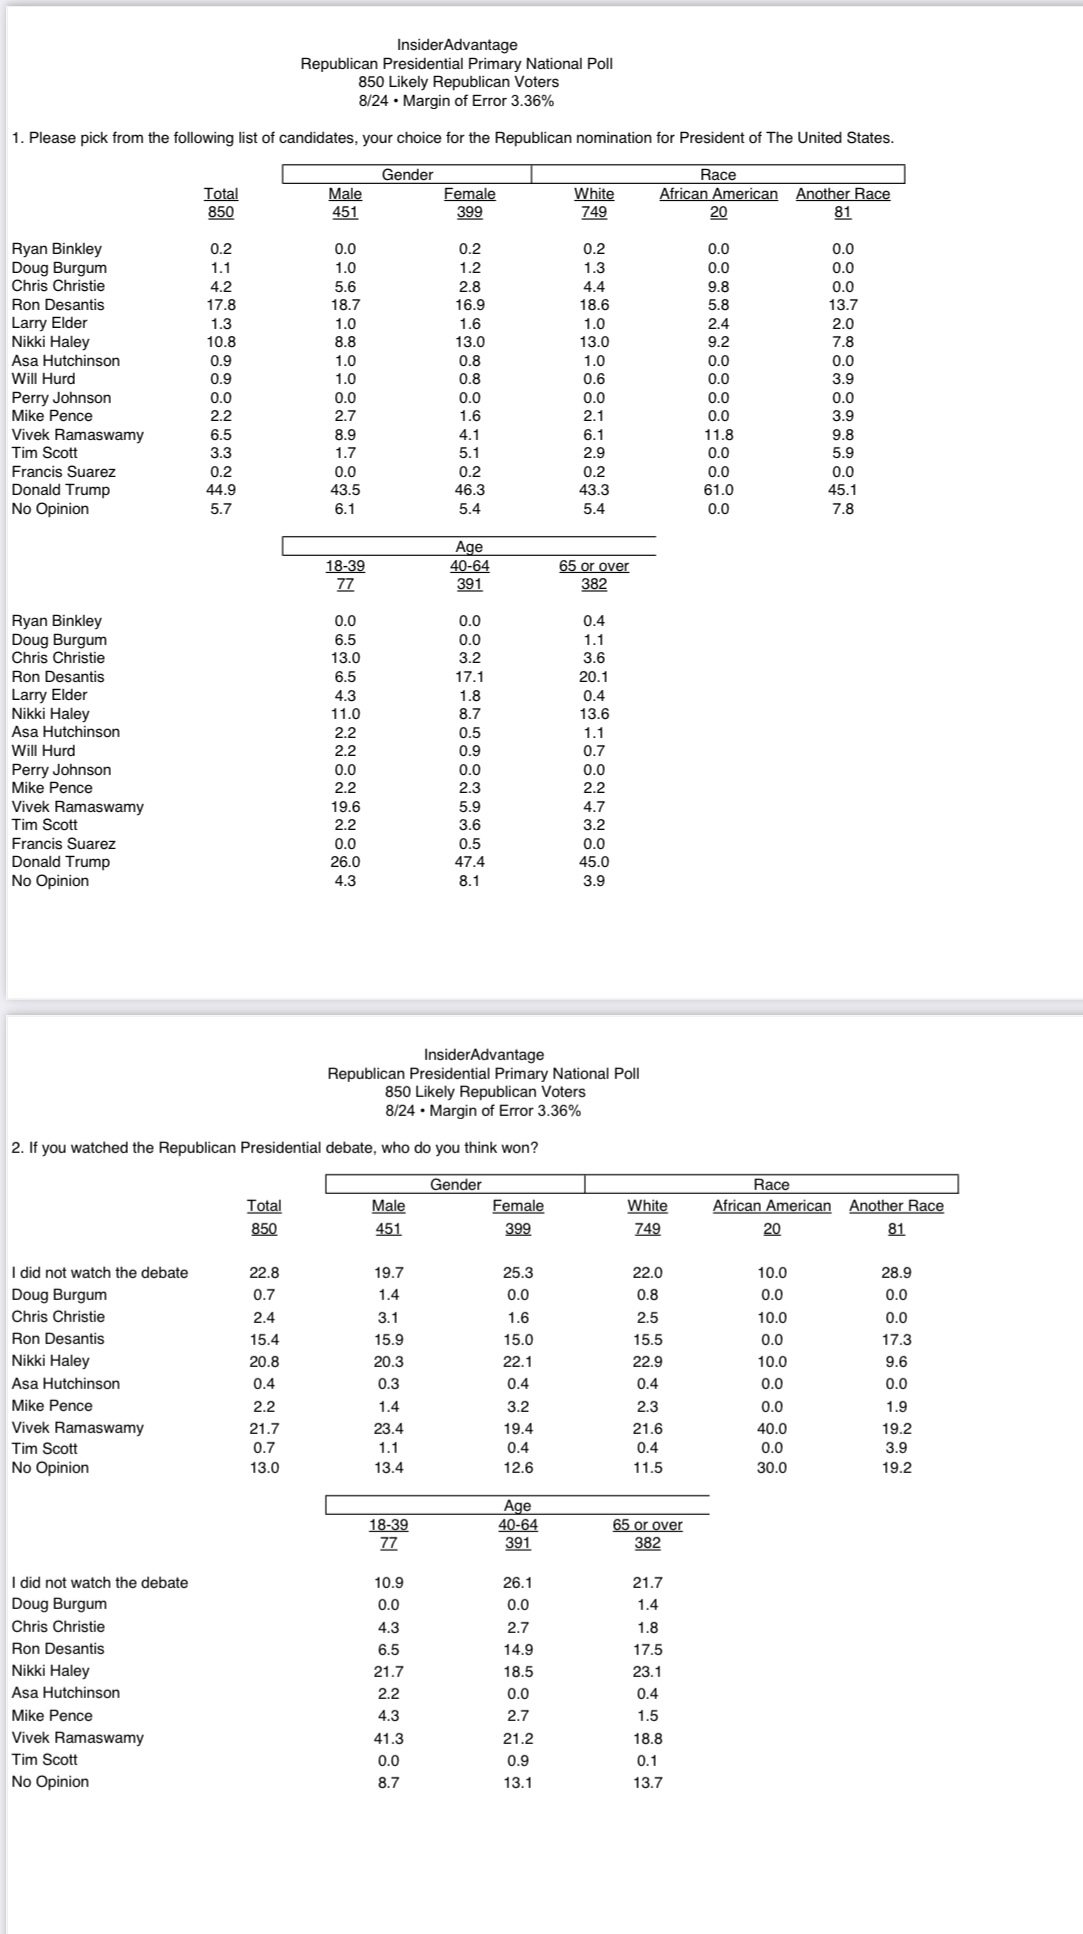
| InsiderAdvantage | August 24, 2023 | 850 (LV) | 1.1% | 4.2% | 17.8% | 1.3% | 10.8% | 0.9% | 2.2% | 6.5% | 3.3% | 44.9% | 7.0%[lower-alpha 112] |
| Léger/New York Post | August 23–24, 2023 | 658 (RV) | – | 1% | 9% | – | 2% | – | 5% | 5% | 3% | 61% | 11%[lower-alpha 113] |
| First debate held. | |||||||||||||
| McLaughlin & Associates | August 15–23, 2023 | 450 (LV) | 1% | 4% | 9% | 1% | 3% | 1% | 4% | 13% | 4% | 51% | 11%[lower-alpha 114] |
| Rasmussen | August 19–21, 2023 | 818 (LV) | 0% | 7% | 10% | 1% | 3% | 1% | 3% | 11% | 4% | 49% | 0%[lower-alpha 115] |
| Yahoo News/YouGov | August 17–21, 2023 | 482 (RV) | 1% | 2% | 12% | 0% | 3% | 0% | 2% | 8% | 4% | 52% | 16%[lower-alpha 116] |
| Premise | August 17–21, 2023 | 463 (A) | – | 1% | 15% | – | 2% | – | 4% | 5% | 3% | 63% | 8%[lower-alpha 117] |
| HarrisX | August 17–21, 2023 | 1,057 (LV) | 0% | 3% | 12% | 0% | 3% | 1% | 4% | 10% | 4% | 52% | 12%[lower-alpha 118] |
| Insider Advantage | August 19–20, 2023 | 750 (LV) | 1.2% | 4.2% | 9.7% | 1.6% | 4.8% | 1.5% | 3.3% | 6.3% | 3.3% | 50.6% | 13.5%[lower-alpha 119] |
| Morning Consult | August 18–20, 2023 | 3,608 (LV) | 0% | 3% | 14% | – | 3% | 1% | 6% | 10% | 3% | 58% | 1%[lower-alpha 120] |
| YouGov/CBS News | August 16–18, 2023 | 531 (LV) | 1% | 2% | 16% | 0% | 2% | 1% | 5% | 7% | 3% | 62% | 0%[lower-alpha 121] |
| Emerson College | August 16–17, 2023 | 465 (LV) | 1.1% | 2.8% | 10.1% | 0.8% | 1.9% | 0.8% | 3.4% | 9.5% | 2.4% | 55.5% | 11.8%[lower-alpha 122] |
| Echelon Insights[upper-alpha 2] | August 15–17, 2023 | 1,017 (LV) | – | 1% | 12% | – | 3% | – | 4% | 15% | 3% | 55% | – |
| 3D Strategic Research | August 15–17, 2023 | 858 (LV) | 0% | 5% | 16% | 0% | 4% | 0% | 6% | 9% | 3% | 50% | 6%[lower-alpha 123] |
| Victory Insights | August 15–17, 2023 | 825 (LV) | – | 5.9% | 12.1% | – | 1.9% | – | 3.5% | 3.7% | 1.2% | 60.8% | 11.0%[lower-alpha 124] |
| JMC Analytics | August 14–17, 2023 | 1,100 (LV) | 0.9% | 4.5% | 13.0% | – | 3.4% | 1.2% | 3.5% | 5.0% | 4.1% | 52.0% | 12.8%[lower-alpha 125] |
| Kaplan Strategies | August 15–16, 2023 | 1,093 (LV) | 1% | 3% | 10% | – | 5% | 3% | 6% | 11% | 3% | 47% | 11%[lower-alpha 126] |
| American Pulse | August 15–16, 2023 | 821 (LV) | – | 4.0% | 13.0% | – | 3.0% | – | 4.0% | 7.1% | 3.5% | 58.0% | – |
| Trafalgar Group | August 14–16, 2023 | 1,082 (LV) | 0.1% | 4.6% | 17.0% | 1.2% | 4.2% | 0.9% | 4.6% | 4.3% | 4.0% | 55.4% | 2.6%[lower-alpha 127] |
| The Economist/YouGov | August 12–15, 2023 | 527 (RV) | 0% | 2% | 15% | 0% | 2% | 0% | 3% | 4% | 3% | 53% | 16%[lower-alpha 128] |
| Fox News/Beacon Research | August 12–14, 2023 | 413 (RV) | 1% | 3% | 16% | 0% | 4% | 0% | 5% | 11% | 3% | 53% | 0%[lower-alpha 129] |
| RMG Research | August 11–14, 2023 | 229 (LV) | – | 5% | 8% | – | 4% | – | 4% | 13% | 2% | 60% | – |
| Quinnipiac University | August 10–14, 2023 | 681 (RV) | 0% | 3% | 18% | 0% | 3% | 1% | 4% | 5% | 3% | 57% | 6%[lower-alpha 130] |
| Morning Consult | August 11–13, 2023 | 3,064 (LV) | 1% | 3% | 16% | – | 3% | 1% | 7% | 9% | 3% | 57% | 2%[lower-alpha 131] |
| Kaplan Strategies | August 9–10, 2023 | 800 (LV) | 1% | 4% | 10% | – | 4% | 0% | 8% | 11% | 2% | 48% | 13%[lower-alpha 132] |
| Premise | August 2–7, 2023 | 484 (A) | – | 2% | 16% | – | 3% | – | 6% | 6% | 3% | 57% | 6%[lower-alpha 133] |
| Fairleigh Dickinson University | July 31 – August 7, 2023 | 806 (LV) | 1% | 5% | 15% | 0% | 3% | 0% | 5% | 3% | 2% | 58% | 6%[lower-alpha 134] |
| Morning Consult | August 4–6, 2023 | 3,486 (LV) | 0% | 3% | 16% | – | 3% | 1% | 6% | 8% | 3% | 59% | 1%[lower-alpha 135] |
| I&I/TIPP | August 2–4, 2023 | 529 (RV) | 0% | 0% | 12% | 0% | 4% | 0% | 5% | 8% | 2% | 57% | 10%[lower-alpha 136] |
| Reuters/Ipsos | August 2–3, 2023 | 355 (A) | 0% | 0% | 13% | – | 5% | 1% | 8% | 7% | 2% | 47% | 17%[lower-alpha 137] |
| Cygnal | August 1–3, 2023 | (LV) | 0.2% | 2.1% | 10.4% | 0.2% | 2.8% | 0.3% | 6.6% | 11.4% | 3.2% | 53.3% | 9.6%[lower-alpha 138] |
| Morning Consult | July 28–30, 2023 | 3,716 (LV) | 1% | 3% | 15% | – | 3% | 0% | 7% | 9% | 3% | 58% | 2%[lower-alpha 139] |
| Echelon Insights | July 24–27, 2023 | 399 (LV) | 1% | 1% | 16% | 0% | 2% | 1% | 3% | 11% | 3% | 56% | 5%[lower-alpha 140] |
| The New York Times/Siena College | July 23–27, 2023 | 932 (LV) | 0% | 2% | 17% | 0% | 3% | 0% | 3% | 2% | 3% | 54% | 14%[lower-alpha 141] |
| Big Village | July 24–26, 2023 | 718 (A) | 0.5% | 0.9% | 13.5% | 0.4% | 3.2% | 0.7% | 7.5% | 7.2% | 2.6% | 61.0% | 2.5%[lower-alpha 142] |
| Premise | July 21–26, 2023 | 442 (A) | – | 1% | 16% | – | 2% | – | 7% | 4% | 3% | 59% | 9%[lower-alpha 143] |
| Economist/YouGov | July 22–25, 2023 | 537 | 0% | 1% | 18% | 0% | 3% | 0% | 3% | 5% | 3% | 55% | 13%[lower-alpha 144] |
| McLaughlin & Associates | July 19–24, 2023 | 452 (LV) | 0% | 2% | 13% | 0% | 3% | 0% | 5% | 8% | 3% | 52% | 14%[lower-alpha 145] |
| Morning Consult | July 21–23, 2023 | 3,576 | 1% | 2% | 16% | – | 4% | 0% | 6% | 8% | 2% | 59% | 1%[lower-alpha 146] |
| JMC Analytics | July 18–22, 2023 | 1,100 (LV) | 1.0% | 4.4% | 17.0% | – | 3.1% | 1.0% | 3.2% | 2.9% | 4.5% | 53.0% | 10%[lower-alpha 147] |
| Harvard-Harris | July 19–20, 2023 | 729 (RV) | 1% | 2% | 12% | 0% | 4% | 1% | 7% | 10% | 2% | 52% | 10%[lower-alpha 148] |
| Rasmussen Reports | July 18–20, 2023 | 1,031 (LV) | – | 5% | 13% | – | 3% | 3% | 5% | 3% | 4% | 57% | 5% |
| Monmouth University | July 12–19, 2023 | 681 (RV) | 1% | 3% | 22% | 0% | 3% | 0% | 3% | 5% | 3% | 54% | 7%[lower-alpha 149] |
| Kaplan Strategies | July 17–18, 2023 | 800 (LV) | 0% | 5% | 12% | – | 3% | 1% | 4% | 12% | 5% | 48% | 10% |
| Yahoo News | July 13–17, 2023 | 468 | 1% | 1% | 23% | 0% | 3% | 0% | 3% | 3% | 4% | 48% | 13%[lower-alpha 150] |
| Quinnipiac University | July 13–17, 2023 | 727 (RV) | 0% | 3% | 25% | 0% | 4% | 0% | 4% | 2% | 3% | 54% | 3%[lower-alpha 151] |
| Reuters/Ipsos | July 11–17, 2023 | 4,414 | 0% | 3% | 19% | – | 3% | 0% | 7% | 9% | 2% | 47% | 11%[lower-alpha 152] |
| Morning Consult | July 14–16, 2023 | 3,630 | 0% | 2% | 20% | – | 4% | 0% | 7% | 8% | 3% | 55% | 1%[lower-alpha 153] |
| Premise | July 7–14, 2023 | 355 (RV) | – | 2% | 19% | – | 3% | – | 5% | 4% | 2% | 58% | 9%[lower-alpha 154] |
| YouGov/The Economist | July 8–11, 2023 | 502 (RV) | 0% | 2% | 22% | 0% | 3% | 0% | 5% | 2% | 3% | 48% | 13%[lower-alpha 155] |
| Morning Consult | July 7–9, 2023 | 3,616 | 0% | 3% | 17% | – | 3% | 1% | 7% | 8% | 3% | 56% | 1%[lower-alpha 156] |
| I&I/TIPP | July 5–7, 2023 | 486 (RV) | 1% | 2% | 14% | 1% | 3% | 1% | 6% | 7% | 3% | 53% | 9%[lower-alpha 157] |
| Echelon Insights | June 26–29, 2023 | 413 (LV) | 1% | 2% | 16% | 0% | 5% | 0% | 5% | 10% | 4% | 49% | 7%[lower-alpha 158] |
| Fox News | June 23–26, 2023 | 391 | 0% | 1% | 22% | 1% | 3% | 1% | 4% | 5% | 4% | 56% | 4%[lower-alpha 159] |
| Morning Consult | June 23–25, 2023 | 3,650 | 0% | 2% | 19% | – | 3% | 1% | 7% | 6% | 3% | 57% | 1%[lower-alpha 160] |
| Will Hurd declares his candidacy. | |||||||||||||
| Emerson College | June 19–20, 2023 | 365 (RV) | 1% | 2% | 21% | – | 4% | 1% | 6% | 2% | 2% | 59% | 2%[lower-alpha 161] |
| NBC News | June 16–20, 2023 | 500 (RV) | 0% | 5% | 22% | – | 4% | 2% | 7% | 3% | 3% | 51% | 0%[lower-alpha 162] |
| YouGov | June 16–20, 2023 | 366 (RV) | 0% | 4% | 25% | 1% | 2% | 0% | 5% | 2% | 4% | 47% | 10%[lower-alpha 163] |
| Morning Consult | June 17–19, 2023 | 3,521 (PV) | 0% | 3% | 20% | – | 3% | 1% | 7% | 3% | 3% | 57% | 1%[lower-alpha 164] |
| McLaughlin & Associates | June 15–19, 2023 | 454 | 1% | 2% | 19% | 0% | 4% | 0% | 5% | 2% | 5% | 52% | 9%[lower-alpha 165] |
| CNN/SSRS | June 13–17 2023 | 1,350 (A) | 0% | 3% | 26% | 0% | 5% | 1% | 9% | 1% | 4% | 47% | 2%[lower-alpha 166] |
| Harvard-Harris | June 14–15, 2023 | 2,090 (RV) | 0% | 2% | 14% | – | 4% | 0% | 8% | 3% | 2% | 59% | 7%[lower-alpha 167] |
| The Messenger/HarrisX | June 14–15, 2023 | 283 (RV) | 0% | 2% | 17% | – | 3% | 1% | 6% | 2% | 4% | 53% | 11%[lower-alpha 168] |
| Francis Suarez declares his candidacy. | |||||||||||||
| Big Village | June 9–14, 2023 | 724 (RV) | 1.0% | 1.4% | 15.3% | 1.1% | 4.5% | 0.8% | 9.9% | 3.2% | 3.6% | 56.4% | 3.0%[lower-alpha 169] |
| Economist/YouGov | June 10–13, 2023 | 411 (RV) | – | 2% | 21% | – | 4% | – | 4% | 1% | 3% | 51% | 14%[lower-alpha 170] |
| Quinnipiac University | June 8–12, 2023 | 700 (RV) | 0% | 4% | 23% | 0% | 4% | 1% | 4% | 3% | 4% | 53% | – |
| Morning Consult | June 9–11, 2023 | 3,419 | 0% | 2% | 19% | – | 3% | 1% | 8% | 3% | 4% | 59% | 1%[lower-alpha 171] |
| CBS News | June 7–10, 2023 | 2,480 (A) | 1% | 1% | 23% | 1% | 3% | 1% | 4% | 1% | 4% | 61% | – |
| USA Today/Suffolk | June 5–9, 2023 | – | 0% | 2% | 23% | 1% | 4% | 1% | 4% | – | 6% | 48% | – |
| Reuters/Ipsos | June 5–9, 2023 | 1,005 (A) | 1% | 2% | 22% | 0% | 3% | 0% | 7% | 3% | 2% | 43% | 17%[lower-alpha 172] |
| Doug Burgum declares his candidacy. | |||||||||||||
| Chris Christie declares his candidacy. | |||||||||||||
| Mike Pence declares his candidacy. | |||||||||||||
| Morning Consult | June 2–4, 2023 | 3,545 (LV) | – | 1% | 22% | – | 3% | 1% | 7% | 3% | 3% | 56% | 5%[lower-alpha 173] |
| I&I/TIPP | May 31 – June 2, 2023 | 1,230 (RV) | – | 1% | 19% | 0% | 3% | 1% | 6% | 2% | 3% | 55% | 10%[lower-alpha 174] |
| Premise | May 29 – June 1, 2023 | 563 (RV) | – | 1% | 20% | – | 3% | – | 4% | 1% | 2% | 57% | 11%[lower-alpha 175] |
| YouGov | May 25–30, 2023 | 432 (RV) | – | – | 25% | 1% | 3% | 1% | – | 3% | 3% | 53% | 11% |
| Big Village | May 26–28, 2023 | 389 | – | – | 24% | – | 5% | 1% | – | 3% | 5% | 58% | 5%[lower-alpha 176] |
| Morning Consult | May 26–28, 2023 | 3,485 (LV) | – | – | 22% | – | 4% | 1% | 5% | 4% | 3% | 56% | 5%[lower-alpha 177] |
| Ron DeSantis declares his candidacy. | |||||||||||||
| McLaughlin & Associates | May 17–24, 2023 | 446 (LV) | 0% | 1% | 16% | 0% | 3% | 1% | 7% | 4% | 2% | 54% | 13%[lower-alpha 178] |
| FOX News | May 19–22, 2023 | 412 (RV) | – | 0% | 20% | 0% | 4% | 0% | 5% | 4% | 2% | 53% | 12%[lower-alpha 179] |
| Quinnipiac | May 18–22, 2023 | 1,616 (RV) | – | 2% | 25% | 1% | 3% | 0% | 2% | 1% | 2% | 56% | 8%[lower-alpha 180] |
| Morning Consult | May 19–21, 2023 | 3,526 (LV) | – | – | 20% | – | 4% | 0% | 6% | 4% | 2% | 58% | 6%[lower-alpha 181] |
| CNN | May 17–20, 2023 | 467 (RV) | 1% | 2% | 26% | 0% | 6% | 1% | 6% | 1% | 1% | 53% | 2%[lower-alpha 182] |
| Tim Scott declares his candidacy. | |||||||||||||
| Harvard-Harris | May 17–18, 2023 | 2,004 (RV) | – | – | 16% | – | 4% | 1% | 4% | 4% | 1% | 58% | 12%[lower-alpha 183] |
| Cygnal | May 16–18, 2023 | 2,527 (LV) | – | – | 20.9% | – | 4.7% | 1.0% | 4.3% | 4.8% | 1.5% | 51.5% | 11.3%[lower-alpha 184] |
| Marquette University | May 8–18, 2023 | 1,000 (A) | – | 0% | 25% | 1% | 5% | 0% | 2% | 3% | 1% | 46% | 17%[lower-alpha 185] |
| Rasmussen Reports | May 11–15, 2023 | 996 (LV) | – | – | 17% | – | 5% | 3% | 6% | 2% | – | 62% | 5%[lower-alpha 186] |
| Reuters/Ipsos | May 9–15, 2023 | 4,410 (A) | – | – | 21% | – | 4% | 1% | 5% | 4% | 1% | 49% | 15%[lower-alpha 187] |
| Morning Consult | May 12–14, 2023 | 3,571 (LV) | – | – | 18% | – | 4% | 1% | 6% | 4% | 1% | 61% | 5%[lower-alpha 188] |
| Morning Consult | May 5–7, 2023 | 3,574 (RV) | – | – | 19% | – | 3% | 1% | 5% | 5% | 1% | 60% | 4%[lower-alpha 189] |
| I&I/TIPP | May 3–5, 2023 | 469 (RV) | – | – | 17% | 1% | 4% | 1% | 6% | 4% | 2% | 55% | 10%[lower-alpha 190] |
| ABC News/Washington Post | April 28 – May 3, 2023 | 438 (LV) | – | – | 25% | – | 6% | 1% | 6% | – | 4% | 53% | 5%[lower-alpha 191] |
| Premise | April 27 – May 1, 2023 | 752 (RV) | – | 1% | 21% | – | 4% | – | 5% | 2% | 1% | 58% | 8%[lower-alpha 192] |
| Morning Consult | April 28–30, 2023 | 3,389 (LV) | – | – | 22% | – | 4% | – | 7% | 3% | 2% | 56% | 5%[lower-alpha 193] |
| CBS News | April 27–29, 2023 | 2,372 (A) | – | 2% | 22% | 2% | 4% | 1% | 5% | 5% | 1% | 58% | – |
| Emerson College | April 24–25, 2023 | 446 (LV) | – | 2% | 16% | – | 3% | 2% | 7% | 3% | – | 62% | 4%[lower-alpha 194] |
| FOX News | April 21–24, 2023 | 408 (RV) | – | – | 21% | 1% | 4% | – | 6% | 3% | 2% | 53% | 2%[lower-alpha 195] |
| Reuters/Ipsos | April 21–24, 2023 | 361 (RV) | – | – | 23% | 1% | 3% | – | 6% | 2% | – | 49% | 17%[lower-alpha 196] |
| Ryan Binkley declares his candidacy. | |||||||||||||
| Morning Consult | April 21–23, 2023 | 3,640 (LV) | – | – | 21% | – | 3% | 1% | 7% | 3% | 1% | 58% | 6%[lower-alpha 197] |
| Larry Elder declares his candidacy. | |||||||||||||
| Cygnal | April 18–20, 2023 | 2,500 (LV) | – | – | 25.5% | – | 4.6% | 1.3% | 4.5% | 2% | 1.5% | 46.1% | 14.5%[lower-alpha 198] |
| Harvard-Harris | April 18–19, 2023 | 1,845 (RV) | – | – | 20% | – | 4% | 0% | 7% | 2% | 1% | 55% | 4%[lower-alpha 199] |
| NBC News | April 14–18, 2023 | 1,000 (RV) | – | – | 31% | – | 3% | 3% | 6% | 2% | 3% | 46% | 2%[lower-alpha 200] |
| Wall Street Journal | April 11–17, 2023 | 600 (LV) | – | – | 24% | – | 5% | – | 1% | 2% | 3% | 48% | 17%[lower-alpha 201] |
| Morning Consult | April 14–16, 2023 | 3,499 (LV) | – | – | 24% | – | 4% | – | 7% | 3% | 2% | 53% | 5%[lower-alpha 202] |
| Tim Scott forms his exploratory committee. | |||||||||||||
| Morning Consult | April 7–9, 2023 | 3,608 (LV) | – | – | 23% | – | 4% | 1% | 7% | 1% | 1% | 56% | 7%[lower-alpha 203] |
| Reuters/Ipsos | April 5–6, 2023 | 1,004 (A) | – | 0% | 21% | – | 1% | 1% | 4% | 1% | – | 58% | 5%[lower-alpha 204] |
| Reuters | March 22 – April 3, 2023 | 2,005 (LV) | – | 2% | 19% | – | 6% | – | 5% | – | – | 48% | 5%[lower-alpha 205] |
| Asa Hutchinson declares his candidacy. | |||||||||||||
| Morning Consult | March 31 – April 2, 2023 | 3,488 (RV) | – | – | 26% | – | 4% | – | 7% | – | 1% | 55% | 7% [lower-alpha 206] |
| Trafalgar | March 31 – April 2, 2023 | 1,123 (RV) | – | – | 22.5% | 0.4% | 3.7% | – | 3.8% | 0.5% | 1% | 56.2% | 12%[lower-alpha 207] |
| InsiderAdvantage | March 31 – April 1, 2023 | 550 (LV) | – | 2% | 24% | – | 5% | – | 4% | 1% | 0% | 57% | 3%[lower-alpha 208] |
| YouGov | March 30–31, 2023 | 1,089 (A) | – | 2% | 21% | – | 5% | – | 3% | 1% | – | 52% | 2%[lower-alpha 209] |
| Echelon Insights | March 27–29, 2023 | 370 (RV) | – | 0% | 26% | – | 4% | – | 8% | 1% | 1% | 49% | 2%[lower-alpha 210] |
| Morning Consult | March 24–28, 2023 | 3,452 (RV) | – | – | 26% | – | 5% | – | 7% | 1% | 2% | 52% | 7%[lower-alpha 211] |
| Cygnal | March 26–27, 2023 | 2,550 (RV) | – | – | 28.7% | – | 4.1% | – | 5.7% | 1.1% | 1% | 42.2% | 17.1%[lower-alpha 212] |
| FOX News | March 24–27, 2023 | 426 (RV) | – | 1% | 24% | – | 3% | 1% | 6% | 1% | 0% | 54% | 9%[lower-alpha 213] |
| Beacon Research/Fox News | March 24–27, 2023 | – | – | 1% | 24% | – | 3% | 1% | 6% | 1% | – | 54% | 8%[lower-alpha 214] |
| Quinnipiac University | March 23–27, 2023 | 671 (RV) | – | 1% | 33% | – | 4% | – | 5% | – | 1% | 47% | 7%[lower-alpha 215] |
| Harris Poll | March 22–23, 2023 | – | – | – | 24% | – | 5% | – | 7% | 0% | 2% | 50% | 6%[lower-alpha 216] |
| Monmouth University | March 16–20, 2023 | 521 (RV) | – | – | 27% | – | 3% | – | 1% | – | 1% | 41% | 6%[lower-alpha 217] |
| Morning Consult | March 17–19, 2023 | 3,394 (RV) | – | – | 26% | – | 4% | – | 7% | 1% | 1% | 54% | 7%[lower-alpha 218] |
| Big Village | March 15–17, 2023 | 361 (A) | – | – | 23.3% | – | 3.6% | – | 10.2% | 0.5% | – | 51.9% | 10.4%[lower-alpha 219] |
| Quinnipiac | March 9–13, 2023 | 677 (RV) | – | 1% | 32% | – | 5% | 0% | 3% | 0% | 1% | 46% | 12%[lower-alpha 220] |
| CNN | March 8–12, 2023 | 963 (LV) | – | – | 36% | – | 6% | 1% | 6% | – | 2% | 40% | 8%[lower-alpha 221] |
| Premise | March 4–7, 2023 | 639 (RV) | – | – | 23% | – | 6% | – | 5% | – | 1% | 55% | 11%[lower-alpha 222] |
| Morning Consult | March 3–5, 2023 | 3,071 (RV) | – | – | 28% | – | 4% | – | 7% | 0% | 1% | 53% | 5%[lower-alpha 223] |
| Perry Johnson declares his candidacy. | |||||||||||||
| Yahoo News | February 23–27, 2023 | 444 (RV) | – | 0% | 29% | – | 4% | – | 2% | – | – | 45% | 19%[lower-alpha 224] |
| Susquehanna | February 19–26, 2023 | 300 (RV) | – | – | 37% | – | 4% | – | 2% | – | 1% | 32% | 20%[lower-alpha 225] |
| Emerson College | February 24–25, 2023 | 536 (RV) | – | – | 25% | – | 5% | – | 8% | – | – | 55% | 7%[lower-alpha 226] |
| Morning Consult | February 23–25, 2023 | 3,320 (RV) | – | – | 30% | – | 6% | – | 7% | 1% | 1% | 48% | 7%[lower-alpha 227] |
| Echelon Insights | February 21–23, 2023 | 419 (LV) | – | – | 31% | – | 6% | – | 9% | – | – | 41% | – |
| McLaughlin & Associates | February 17–23, 2023 | 441 (LV) | – | – | 26% | – | 6% | – | 5% | 1% | 1% | 42% | 21%[lower-alpha 228] |
| Fox News | February 19–22, 2023 | 413 | – | 0% | 28% | – | 7% | 0% | 7% | – | 1% | 43% | 14%[lower-alpha 229] |
| Vivek Ramaswamy declares his candidacy. | |||||||||||||
| Rasmussen Reports | February 16–20, 2023 | – | – | – | 24% | – | 15% | – | – | – | – | 52% | – |
| Morning Consult | February 17–19, 2023 | 3,217 (RV) | – | – | 30% | – | 6% | – | 6% | – | – | 50% | 1%[lower-alpha 230] |
| Big Village | February 15–17, 2023 | 346 (A) | – | – | 23.6% | – | 6.8% | – | 8.7% | 0% | – | 50.2% | 10.8%[lower-alpha 231] |
| Harris Poll | February 15–16, 2023 | – | – | – | 23% | – | 6% | – | 7% | – | 1% | 46% | 7%[lower-alpha 232] |
| Morning Consult | February 14–16, 2023 | 2,476 (RV) | – | – | 29% | – | 5% | – | 7% | – | – | 50% | 1%[lower-alpha 233] |
| WPA Intelligence | February 13–16, 2023 | 1,000 (LV) | – | – | 40% | – | 8% | – | 8% | – | – | 31% | – |
| Nikki Haley declares her candidacy. | |||||||||||||
| Quinnipiac University | February 9–14, 2023 | 592 (RV) | – | – | 37% | – | 4% | – | 4% | – | – | 50% | 5%[lower-alpha 234] |
| 592 (RV) | – | 0% | 31% | – | 4% | 0% | 3% | – | 1% | 48% | 10%[lower-alpha 235] | ||
| Morning Consult | February 11–13, 2023 | 2,476 (RV) | – | – | 31% | – | 4% | – | 8% | – | – | 47% | 1%[lower-alpha 236] |
| Ipsos | February 6–13, 2023 | 1,465 (RV) | – | 1.1% | 30.6% | – | 3.9% | – | 7.5% | – | – | 42.6% | 6.6%[lower-alpha 237] |
| Morning Consult | February 8–10, 2023 | 2,476 (RV) | – | – | 29% | – | 4% | – | 6% | – | – | 48% | 2%[lower-alpha 238] |
| Morning Consult | February 5–7, 2023 | 2,476 (RV) | – | – | 31% | – | 4% | – | 6% | – | – | 48% | 2%[lower-alpha 239] |
| OnMessage | January 30 – February 5, 2023 | 566 (RV) | – | – | 34% | – | 6% | – | 6% | – | 1% | 34% | 20%[lower-alpha 240] |
| YouGov | February 2–4, 2023 | 453 (RV) | – | – | 35% | – | 2% | – | 5% | – | – | 37% | – |
| Morning Consult | February 2–4, 2023 | 2,476 (RV) | – | – | 32% | – | 3% | – | 7% | – | – | 48% | 2%[lower-alpha 241] |
| Monmouth University | January 26 – February 2, 2023 | 566 (RV) | – | – | 33% | – | 1% | – | 2% | – | – | 33% | 7%[lower-alpha 242] |
| Morning Consult | January 30 – February 1, 2023 | 2,476 (RV) | – | – | 30% | – | 2% | – | 7% | – | – | 51% | 2%[lower-alpha 243] |
| Morning Consult | January 27–29, 2023 | 3,592 (RV) | – | – | 31% | – | 3% | – | 7% | – | – | 48% | 2%[lower-alpha 244] |
| Morning Consult | January 24–26, 2023 | 2,476 (RV) | – | – | 30% | – | 3% | – | 7% | – | – | 50% | 2%[lower-alpha 245] |
| Echelon Insights | January 23–25, 2023 | 467 (LV) | – | 0% | 34% | – | 2% | – | 8% | – | – | 36% | 8%[lower-alpha 246] |
| McLaughlin & Associates | January 19–24, 2023 | 457 (LV) | – | – | 31% | – | 3% | – | 5% | – | 1% | 43% | 18%[lower-alpha 247] |
| Morning Consult | January 21–23, 2023 | 2,476 (RV) | – | – | 31% | – | 3% | – | 7% | – | – | 49% | 2%[lower-alpha 248] |
| WPA Intelligence | January 17–23, 2023 | 3,015 (LV) | – | – | 33% | – | 5% | – | 7% | – | – | 37% | – |
| Emerson College | January 19–21, 2023 | 428 (RV) | – | – | 24.8% | – | 2.5% | – | 7.5% | – | – | 55.1% | 10.2%[lower-alpha 249] |
| North Star Opinion Research | January 16–21, 2023 | 1,000 (LV) | – | – | 39% | – | 4% | – | 9% | – | 1% | 28% | 21%[lower-alpha 250] |
| Big Village | January 18–20, 2023 | 355 (A) | – | – | 27.5% | – | 2.9% | – | 6.8% | – | – | 52.5% | 10.3%[lower-alpha 251] |
| Harris Poll | January 18–19, 2023 | – | – | – | 28% | – | 3% | – | 7% | – | – | 48% | 0%[lower-alpha 252] |
| Schoen Cooperman Research | January 14–18, 2023 | – | – | – | 31% | – | 3% | – | 8% | – | – | 42% | 2%[lower-alpha 253] |
| Morning Consult | January 15–17, 2023 | 2,476 (RV) | – | – | 32% | – | 3% | – | 8% | – | – | 47% | 2%[lower-alpha 254] |
| Morning Consult | January 15–17, 2023 | 2,476 (RV) | – | – | 30% | – | 3% | – | 8% | – | – | 48% | 2%[lower-alpha 255] |
| YouGov | January 14–17, 2023 | 472 (RV) | – | – | 32% | – | 4% | – | 5% | – | – | 44% | – |
| 500 (A) | – | – | 29% | – | 5% | – | 6% | – | – | 44% | 3%[lower-alpha 256] | ||
| YouGov | January 12–16, 2023 | 450 (LV) | – | 1% | 36% | – | 1% | – | 5% | – | – | 37% | – |
| Morning Consult | January 12–14, 2023 | 2,476 (RV) | – | – | 30% | – | 2% | – | 8% | – | – | 50% | 1%[lower-alpha 257] |
| Public Policy Polling | January 10–11, 2023 | 446 (LV) | – | – | 36% | – | 6% | – | 6% | – | – | 42% | – |
| Morning Consult | January 9–11, 2023 | 2,476 (RV) | – | – | 32% | – | 3% | – | 8% | – | – | 47% | 1%[lower-alpha 258] |
| YouGov | January 5–9, 2023 | 346 (RV) | – | – | 34% | – | 3% | 1% | 7% | – | 2% | 37% | 14%[lower-alpha 259] |
| Morning Consult | January 6–8, 2023 | 4,470 (RV) | – | – | 33% | – | 2% | – | 9% | – | – | 46% | 1%[lower-alpha 260] |
| Big Village | January 4–6, 2023 | 343 (A) | – | – | 35% | – | 2% | – | 8% | – | – | 48% | – |
| Morning Consult | January 3–5, 2023 | 2,476 (RV) | – | – | 32% | – | 2% | – | 8% | – | – | 48% | 1%[lower-alpha 261] |
| Morning Consult | December 31, 2022 – January 2, 2023 | 4,829 (RV) | – | – | 34% | – | 3% | – | 8% | – | – | 45% | 2%[lower-alpha 262] |
| Polls taken between June and December 2022 | ||||||||||||||||
|---|---|---|---|---|---|---|---|---|---|---|---|---|---|---|---|---|
| Poll source | Date(s) administered |
Sample size |
Greg Abbott |
Liz Cheney |
Ted Cruz |
Ron DeSantis |
Nikki Haley |
Larry Hogan |
Mike Pence |
Mike Pompeo |
Marco Rubio |
Tim Scott |
Chris Sununu |
Donald Trump |
Glenn Youngkin |
Other |
| Morning Consult | December 28–30, 2022 | 2,476 (RV) | 1% | 3% | 3% | 33% | 2% | – | 8% | 1% | – | 1% | – | 47% | 0% | 2%[lower-alpha 263] |
| Morning Consult | December 25–27, 2022 | 2,476 (RV) | 1% | 3% | 3% | 33% | 2% | – | 8% | 1% | – | 1% | – | 47% | 0% | 2%[lower-alpha 264] |
| Morning Consult | December 22–24, 2022 | 2,476 (RV) | 1% | 3% | 2% | 31% | 3% | – | 8% | 1% | – | 1% | – | 48% | 1% | 2%[lower-alpha 265] |
| Morning Consult | December 19–21, 2022 | 2,476 (RV) | 1% | 3% | 2% | 34% | 2% | – | 8% | 1% | – | 1% | – | 46% | 1% | 2%[lower-alpha 266] |
| YouGov | December 15–19, 2022 | 449 (RV) | – | 3% | – | 37% | 5% | 1% | 4% | 1% | – | – | – | 39% | 1% | 2%[lower-alpha 267] |
| Morning Consult | December 16–18, 2022 | 4,105 (RV) | 1% | 2% | 3% | 33% | 2% | – | 8% | 1% | – | 1% | – | 48% | 0% | 2%[lower-alpha 268] |
| Big Village | December 16–18, 2022 | 357 (A) | – | 3% | 4% | 27% | 4% | – | 10% | – | – | – | 1% | 51% | 1% | – |
| Harris Poll | December 14–15, 2022 | 666 (RV) | – | – | 2% | 25% | 4% | – | 6% | 2% | 1% | 1% | – | 48% | 0% | – |
| Morning Consult | December 13–15, 2022 | 2,476 (RV) | 1% | 2% | 3% | 32% | 2% | – | 7% | 1% | – | 1% | – | 48% | 0% | 2%[lower-alpha 269] |
| Echelon Insights | December 12–14, 2022 | 418 (RV) | 0% | 0% | 2% | 35% | 3% | 0% | 4% | 1% | 1% | 0% | 0% | 40% | 0% | 7%[lower-alpha 270] |
| 454 (LV) | 0% | 1% | 2% | 32% | 4% | 0% | 4% | 0% | 1% | 1% | 0% | 41% | 0% | 6%[lower-alpha 271] | ||
| Cygnal | December 12–14, 2022 | 1,019 (LV) | 1% | 3% | 2% | 35% | 4% | 1% | 7% | 0% | 1% | 1% | 0% | 40% | 0% | 7%[lower-alpha 272] |
| Morning Consult | December 10–14, 2022 | 825 (RV) | 1% | 2% | 3% | 34% | 2% | – | 6% | 1% | – | 2% | – | 40% | 0% | 2%[lower-alpha 273] |
| McLaughlin & Associates | December 9–14, 2022 | 480 (LV) | 1% | 4% | – | 23% | 3% | 1% | 5% | 1% | 1% | 1% | – | 48% | 1% | 5%[lower-alpha 274] |
| Morning Consult | December 10–12, 2022 | 2,476 (RV) | 1% | 2% | 3% | 31% | 3% | – | 8% | 1% | – | 1% | – | 50% | 0% | 2%[lower-alpha 275] |
| Monmouth University | December 8–12, 2022 | 563 (RV) | – | – | 1% | 39% | 1% | – | 2% | – | – | – | – | 26% | – | – |
| Morning Consult | December 7–9, 2022 | 2,476 (RV) | 1% | 2% | 2% | 30% | 3% | – | 9% | 1% | – | 1% | – | 48% | 0% | 2%[lower-alpha 276] |
| Morning Consult | December 4–6, 2022 | 2,476 (RV) | 1% | 3% | 3% | 30% | 2% | – | 8% | 0% | – | 1% | – | 50% | 0% | 2%[lower-alpha 277] |
| YouGov | December 1–5, 2022 | 435 (RV) | – | 3% | – | 33% | 6% | 1% | 4% | 2% | – | – | – | 35% | 2% | 2%[lower-alpha 278] |
| 521 (A) | – | 2% | – | 30% | 5% | 1% | 5% | 2% | – | – | – | 35% | 2% | 2%[lower-alpha 279] | ||
| Morning Consult | December 1–3, 2022 | 2,476 (RV) | 1% | 3% | 2% | 30% | 3% | – | 8% | 1% | – | 1% | – | 49% | 0% | 2%[lower-alpha 280] |
| Big Village | November 30 – December 2, 2022 | 368 (A) | – | 2% | 2% | 27% | 3% | – | 7% | – | – | – | 1% | 56% | 0% | – |
| YouGov | November 26–29, 2022 | 385 (A) | – | – | 3% | 30% | 3% | – | 8% | – | 3% | – | – | 36% | – | 9%[lower-alpha 281] |
| Cornell University Collaborative Midterm Survey | October 26 – November 25, 2022 | 3,110 (A) | – | 10% | – | 28% | 4% | – | 11% | 4% | – | – | – | 40% | – | 4%[lower-alpha 282] |
| Ipsos | November 18–20, 2022 | 849 (RV) | 1% | 2% | 2% | 37% | 3% | 2% | 6% | 0% | 0% | 0% | 0% | 25% | 1% | 2%[lower-alpha 283] |
| Morning Consult | November 18–20, 2022 | 849 (RV) | – | 2% | 3% | 30% | 2% | 0% | 7% | 1% | 1% | 0% | – | 45% | – | 5%[lower-alpha 284] |
| Emerson College | November 18–19, 2022 | 614 (RV) | – | 4% | 3% | 25% | 3% | 1% | 8% | – | – | – | – | 42% | – | 2%[lower-alpha 285] |
| Echelon Insights | November 17–19, 2022 | 424 (RV) | 0% | 1% | 3% | 31% | 1% | 1% | 11% | 1% | 1% | 0% | 0% | 42% | 0% | 6%[lower-alpha 286] |
| 424 (LV) | 0% | 1% | 3% | 37% | 1% | 1% | 9% | 1% | 1% | 0% | 0% | 38% | 0% | 5%[lower-alpha 287] | ||
| Harris Poll | November 16–17, 2022 | – | – | – | 3% | 28% | 2% | – | 7% | 1% | 1% | 1% | – | 46% | 1% | – |
| Donald Trump declares his candidacy. | ||||||||||||||||
| Morning Consult | November 10–14, 2022 | 842 (RV) | – | 1% | 2% | 33% | 1% | 1% | 5% | 0% | 1% | 0% | – | 47% | 1% | 6%[lower-alpha 288] |
| Corey Stapleton declares his candidacy. | ||||||||||||||||
| Zogby Analytics | November 9–11, 2022 | 864 (LV) | – | – | – | 28% | 3% | – | 8% | – | – | 1% | – | 47% | 1% | 4%[lower-alpha 289] |
| Big Village | November 9–10, 2022 | 384 (A) | – | 3% | – | 34% | – | – | 10% | – | – | – | – | 50% | – | – |
| 2022 midterm elections | ||||||||||||||||
| Morning Consult | November 2–7, 2022 | 1,691 (RV) | – | – | 2% | 26% | 2% | 0% | 7% | – | 1% | 1% | – | 48% | – | 5%[lower-alpha 290] |
| Big Village | November 2–4, 2022 | 290 (LV) | – | 3% | – | 30% | – | – | 12% | – | – | – | – | 48% | – | – |
| 373 (A) | – | 3% | – | 27% | – | – | 12% | – | – | – | – | 56% | – | – | ||
| Big Village | October 31 – November 2, 2022 | 272 (LV) | – | 2% | – | 28% | – | – | 13% | – | – | – | – | 53% | – | – |
| 354 (A) | – | 3% | – | 26% | – | – | 12% | – | – | – | – | 56% | – | – | ||
| Morning Consult | October 28–31, 2022 | 838 (RV) | – | 2% | 2% | 24% | 3% | 0% | 9% | 1% | 1% | 0% | – | 49% | – | 5%[lower-alpha 291] |
| YouGov | October 11–26, 2022 | 1,720 (RV) | 3% | 2% | – | 33% | 14% | – | – | – | – | – | 1% | 55% | 1% | – |
| YouGov | October 17–19, 2022 | – | – | – | 3% | 29% | 4% | – | 6% | 0% | – | 0% | – | 53% | – | – |
| McLaughlin & Associates | October 12–17, 2022 | 454 (LV) | 1% | 1% | – | 23% | – | 0% | 7% | – | 1% | 0% | – | 53% | – | 4%[lower-alpha 292] |
| Harris Poll | October 12–13, 2022 | 724 (RV) | – | – | 3% | 17% | 2% | – | 7% | 2% | 3% | 1% | 0% | 55% | – | – |
| Cygnal | October 10–12, 2022 | 1,204 (LV) | 1% | 3% | 2% | 26% | 3% | 1% | 9% | 1% | 1% | 0% | 0% | 45% | 0% | 4%[lower-alpha 293] |
| Siena College/The New York Times Upshot | October 9–12, 2022 | 332 (LV) | – | – | 3% | 28% | 4% | – | 7% | 2% | – | – | – | 47% | – | – |
| 332 (RV) | – | – | 4% | 26% | 3% | – | 6% | 2% | – | – | – | 49% | – | 6%[lower-alpha 294] | ||
| Big Village | October 5–7, 2022 | 287 (RV) | – | 3% | – | 28% | – | – | 11% | – | – | – | – | 55% | – | – |
| 372 (A) | – | 3% | – | 23% | – | – | 10% | – | – | – | – | 58% | – | – | ||
| Big Village | September 17–22, 2022 | 323 (RV) | – | 2% | – | 24% | – | – | 12% | – | – | – | – | 59% | – | – |
| 378 (A) | – | 2% | – | 24% | – | – | 12% | – | – | – | – | 61% | – | – | ||
| McLaughlin & Associates | September 17–22, 2022 | 465 (LV) | 2% | 2% | 0% | 18% | 0% | 1% | 6% | 0% | 2% | 1% | – | 55% | – | 6%[lower-alpha 295] |
| Morning Consult | September 16–18, 2022 | 831 (RV) | – | 3% | 2% | 19% | 2% | 0% | 8% | 1% | 1% | 1% | – | 52% | – | 5%[lower-alpha 296] |
| TIPP Insights | September 7–9, 2022 | 534 (RV) | 1% | 1% | 2% | 15% | 2% | – | 8% | 1% | 2% | 1% | – | 54% | – | 5%[lower-alpha 297] |
| Big Village | September 7–9, 2022 | 337 (A) | – | 2% | – | 20% | – | – | 13% | – | – | – | – | 61% | – | – |
| Harris Poll | September 7–8, 2022 | 667 (RV) | – | – | 1% | 17% | 2% | – | 9% | 1% | 1% | 1% | – | 59% | – | – |
| Big Village | August 20–24, 2022 | 329 (A) | – | 2% | – | 22% | – | – | 11% | – | – | – | – | 59% | – | – |
| McLaughlin & Associates | August 20–24, 2022 | 461 (LV) | 2% | 3% | 0% | 15% | 0% | 2% | 6% | 0% | 1% | 1% | – | 55% | – | 8%[lower-alpha 298] |
| Echelon Insights | August 19–22, 2022 | 422 (RV) | – | 4% | – | 22% | – | 2% | 12% | 1% | – | – | – | 46% | – | 2%[lower-alpha 299] |
| 459 (LV) | – | 5% | – | 25% | – | 1% | 13% | 1% | – | – | – | 46% | – | 1%[lower-alpha 300] | ||
| Morning Consult | August 19–21, 2022 | 846 (RV) | – | 3% | 2% | 18% | 3% | 1% | 8% | 0% | 1% | 1% | – | 57% | – | 4%[lower-alpha 301] |
| Big Village | August 10–12, 2022 | 342 (A) | – | 0% | – | 16% | – | – | 11% | – | – | – | – | 68% | – | – |
| Morning Consult | August 10, 2022 | 872 (RV) | – | 2% | 2% | 18% | 2% | 1% | 8% | 1% | 1% | 1% | – | 56% | – | 5%[lower-alpha 302] |
| TIPP Insights | August 2–4, 2022 | 575 (RV) | 1% | 1% | 3% | 17% | 1% | – | 10% | 1% | 1% | 0% | – | 53% | – | 6%[lower-alpha 303] |
| Harris Poll | July 27–28, 2022 | 679 (RV) | – | – | 3% | 19% | 5% | – | 7% | 1% | 1% | 1% | – | 52% | – | – |
| Suffolk University | July 22–25, 2022 | 414 (RV) | – | 3% | – | 34% | 3% | – | 7% | 1% | – | – | – | 43% | – | 1%[lower-alpha 304] |
| Morning Consult | July 15–17, 2022 | 840 (RV) | – | 2% | 3% | 23% | 2% | 0% | 7% | 1% | 1% | 1% | – | 53% | – | 5%[lower-alpha 305] |
| Morning Consult | July 8–10, 2022 | 840 (RV) | – | 2% | 2% | 21% | 3% | 1% | 8% | 1% | 1% | 0% | – | 52% | – | 5%[lower-alpha 306] |
| Siena College/The New York Times Upshot | July 5–7, 2022 | 350 (LV) | – | – | 7% | 25% | 5% | 0% | 6% | 2% | 2% | – | – | 49% | – | 5%[lower-alpha 307] |
| Harris Poll | June 29–30, 2022 | 474 (RV) | – | – | 1% | 16% | 4% | – | 7% | 1% | 2% | 2% | – | 56% | – | |
| – | – | – | 20% | 3% | – | 9% | 1% | – | – | – | 55% | – | – | |||
| Morning Consult | June 24–26, 2022 | 2,004 (RV) | – | 1% | 2% | 23% | 2% | 0% | 8% | 0% | 2% | 0% | – | 51% | – | 5%[lower-alpha 308] |
| McLaughlin & Associates | June 17–22, 2022 | 436 (LV) | 1% | 1% | – | 15% | – | 1% | 7% | – | 2% | 1% | – | 59% | – | 9%[lower-alpha 309] |
| TIPP Insights | June 8–10, 2022 | 385 (RV) | 1% | – | 2% | 12% | 4% | – | 7% | 0% | 2% | 2% | – | 55% | – | 5%[lower-alpha 310] |
| Polls taken between 2020 and June 2022 | ||||||||||||||||
|---|---|---|---|---|---|---|---|---|---|---|---|---|---|---|---|---|
| Source of poll | Dates administered |
Sample size | Margin | Ted Cruz |
Ron DeSantis |
Nikki Haley |
Mike Pence |
Donald Trump |
Other | Undecided[lower-alpha 311] | ||||||
| Corey Stapleton forms his exploratory committee. | ||||||||||||||||
| Harvard/Harris | January 19–20, 2022 | 1,815 (RV) | – | 4% | 12% | 2% | 11% | 57% | 13%[lower-alpha 312] | – | ||||||
| McLaughlin & Associates | January 13–18, 2022 | 468 (LV) | – | – | 13% | 4% | 9% | 53% | – | 8% | ||||||
| John Bolton Super PAC | January 6, 2022 | 501 (LV) | – | 5% | 19% | 4% | 4% | 36% | – | 22% | ||||||
| UMass Amherst | December 14–20, 2021 | 306 (A) | – | 6% | 20% | 7% | 6% | 55% | – | – | ||||||
| McLaughlin & Associates | November 11–16, 2021 | 450 (LV) | – | 2% | 15% | 3% | 7% | 55% | 6% | 8% | ||||||
| Zogby Analytics | November 8–10, 2021 | 371 (LV) | – | 2% | 7% | 5% | 12% | 59% | 6%[lower-alpha 313] | 4% | ||||||
| YouGov/Yahoo News | November 4–8, 2021 | 559 (A) | – | – | 21% | 5% | 4% | 44% | 1%[lower-alpha 314] | 19% | ||||||
| Harvard/Harris | October 26–28, 2021 | 490 (LV) | ±4.0% | – | 10% | – | 9% | 47% | 15% | 19% | ||||||
| YouGov/Yahoo News | October 19–21, 2021 | 629 (A) | – | – | 18% | 4% | 5% | 41% | 2%[lower-alpha 315] | 24% | ||||||
| Echelon Insights (Archive) Archived October 20, 2021, at the Wayback Machine | October 15–19, 2021 | 476 (RV) | – | – | – | – | – | 66%[lower-alpha 316] | 31% | 4% | ||||||
| McLaughlin & Associates | October 14–18, 2021 | 463 (LV) | – | 3% | 10% | 4% | 9% | 53%[lower-alpha 316] | 9%[lower-alpha 317] | 6% | ||||||
| Morning Consult | October 8–11, 2021 | 803 (RV) | – | 3% | 12% | 3% | 12% | 47% | 6%[lower-alpha 318] | 4% | ||||||
| Echelon Insights | September 17–23, 2021 | 479 (RV) | – | – | – | – | – | 59%[lower-alpha 316] | 32% | 9% | ||||||
| John Bolton Super PAC | September 16–18, 2021 | 1,000 (LV) | ± 3.1% | 5% | 25% | 6% | 3% | 26% | 10%[lower-alpha 319] | 20% | ||||||
| Harvard/Harris | September 15–16, 2021 | 490 (LV) | ±4.0% | – | 9% | 3% | 13% | 58% | 0% | 14% | ||||||
| McLaughlin & Associates | September 9–14, 2021 | 456 (LV) | – | 3% | 8% | 2% | 10% | 59%[lower-alpha 316] | 7%[lower-alpha 320] | 4% | ||||||
| Emerson College | August 30 – September 1, 2021 | 395 (RV) | ± 4.9% | 2% | 10% | 7% | 6% | 67% | 5%[lower-alpha 321] | 1% | ||||||
| McLaughlin & Associates | July 29 – August 3, 2021 | 467 (LV) | – | 3% | 11% | 4% | 8% | 54%[lower-alpha 316] | 7%[lower-alpha 322] | 6% | ||||||
| YouGov/Yahoo News | July 30 – August 2, 2021 | 518 (A) | – | – | 13% | 4% | 3% | 58% | 1%[lower-alpha 323] | 17% | ||||||
| Fabrizio, Lee & Associates | July 6–8, 2021 | 800 (RV) | ± 3.5% | 2% | 19% | 3% | 8% | 47%[lower-alpha 316] | 2%[lower-alpha 324] | 13% | ||||||
| John Bolton Super PAC | July 8, 2021 | 1,000 (LV) | – | 5% | 13% | 5% | 6% | 46% | 22% | – | ||||||
| Echelon Insights | June 18–22, 2021 | 386 (RV) | – | – | – | – | – | 59%[lower-alpha 316] | 35% | 6% | ||||||
| McLaughlin & Associates | June 16–20, 2021 | 444 (LV) | – | 4% | 9% | 3% | 8% | 55%[lower-alpha 316] | 8%[lower-alpha 325] | 7% | ||||||
| YouGov/Yahoo News | May 24–26, 2021 | 378 (A) | – | – | – | – | – | 65% | 19%[lower-alpha 326] | 16% | ||||||
| Quinnipiac | May 18–24, 2021 | ~290 (A)[lower-alpha 327] | – | – | – | – | – | 66% | 30%[lower-alpha 328] | 4% | ||||||
| McLaughlin & Associates | May 12–18, 2021 | 444 (LV) | – | 3% | 8% | 5% | 10% | 57%[lower-alpha 316] | 7%[lower-alpha 329] | 7% | ||||||
| Echelon Insights | May 14–17, 2021 | 479 (RV) | – | – | – | – | – | 63%[lower-alpha 316] | 31% | 6% | ||||||
| Morning Consult/Politico | May 14–17, 2021 | 782 (RV) | ± 2% | 4% | 8% | 4% | 13% | 48% | 9%[lower-alpha 330] | – | ||||||
| YouGov/Yahoo News | May 11–13, 2021 | 348 (A) | – | – | – | – | – | 68% | 22%[lower-alpha 331] | 10% | ||||||
| Trafalgar Group | April 30 – May 6, 2021 | – (LV)[lower-alpha 332] | –[lower-alpha 316] | – | – | – | – | 62% | 27%[lower-alpha 333] | 11%[lower-alpha 334] | ||||||
| Echelon Insights | April 16–23, 2021 | 440 (RV) | – | – | – | – | – | 59%[lower-alpha 316] | 35% | 6% | ||||||
| McLaughlin & Associates | April 8–13, 2021 | 441 (LV) | 1% | 3% | 7% | 2% | 10% | 55%[lower-alpha 316] | 8%[lower-alpha 335] | 9% | ||||||
| PEM Management Corporation | April 3–7, 2021 | 494 (LV) | – | 7% | 9% | 9% | 6% | 44% | 1%[lower-alpha 336] | – | ||||||
| Echelon Insights | March 15–21, 2021 | 1,008 (RV) | – | – | – | – | – | 60%[lower-alpha 316] | 30% | 10% | ||||||
| Fabrizio, Lee & Associates/The Hill | February 20 – March 2, 2021 | 1,264 (LV) | ± 2.7% | 3% | 7% | 6% | 9% | 51%[lower-alpha 316] | 3%[lower-alpha 337] | 12% | ||||||
| – | – | – | – | 57%[lower-alpha 338] | 16%[lower-alpha 339] | 27% | ||||||||||
| McLaughlin & Associates | February 24–28, 2021 | 448 (LV) | – | 5% | 4% | 3% | 8% | 54%[lower-alpha 316] | 9%[lower-alpha 340] | 10% | ||||||
| Harvard/Harris | February 23–25, 2021 | 546 (RV) | – | 5% | – | 7% | 18% | 52%[lower-alpha 316] | 13%[lower-alpha 341] | – | ||||||
| Echelon Insights | February 12–18, 2021 | 430 (RV) | – | – | – | – | – | 55%[lower-alpha 316] | 32% | 14% | ||||||
| Morning Consult/Politico | February 14–15, 2021 | 645 (RV) | ± 4% | 4% | – | 6% | 12% | 54% | 10%[lower-alpha 342] | – | ||||||
| Echelon Insights | January 20–26, 2021 | – (RV)[lower-alpha 343] | – | – | – | – | – | 48% | 40% | 11% | ||||||
| Inauguration of Joe Biden | ||||||||||||||||
| Léger | January 15–17, 2021 | 1,007 (A)[lower-alpha 344] | ± 3.09% | 6% | 2% | 7% | 13% | 29%[lower-alpha 316] | 6%[lower-alpha 345] | – | ||||||
| Ipsos/Axios | January 11–13, 2021 | 334 (A) | ± 5.8% | – | – | – | – | 57% | 41% | 1%[lower-alpha 346] | ||||||
| Morning Consult/Politico | January 8–11, 2021 | 702 (RV) | – | 7% | – | 6% | 18% | 40% | 15%[lower-alpha 347] | – | ||||||
| January 6 United States Capitol attack | ||||||||||||||||
| McLaughlin & Associates | December 9–13, 2020 | 442 (LV) | – | 5% | 1% | 3% | 11% | 56% | 5%[lower-alpha 348] | 10% | ||||||
| Fox News | December 6–9, 2020 | ~ 413 (RV) | ± 4.5% | – | – | – | – | 71% | 21%[lower-alpha 349] | 8% | ||||||
| McLaughlin & Associates/Newsmax | November 21–23, 2020 | 442 (LV) | ± 3.1% | 4% | 2% | 4% | 9% | 53%[lower-alpha 316] | 6%[lower-alpha 350] | 15% | ||||||
| Morning Consult/Politico | November 21–23, 2020 | 765 (RV) | ± 2% | 4% | – | 4% | 12% | 53% | 11%[lower-alpha 351] | – | ||||||
| HarrisX/The Hill | November 17–19, 2020 | 599 (RV) | ± 2.26% | – | – | – | – | 75% | 25% | – | ||||||
| Seven Letter Insight | November 10–19, 2020 | ~555 (V)[lower-alpha 352] | ± 2.5% | 6% | – | 7% | 19% | 35% | 4%[lower-alpha 353] | – | ||||||
| Léger | November 13–15, 2020 | 304 (A)[lower-alpha 354] | ± 3.09% | 7% | – | 4% | 22% | 45%[lower-alpha 316] | 5%[lower-alpha 355] | – | ||||||
| 2020 presidential election | ||||||||||||||||
| YouGov/Washington Examiner | October 30, 2020 | – (RV)[lower-alpha 356] | – | – | – | – | – | 38% | 43%[lower-alpha 357] | – | ||||||
Favorability polling
Unlike traditional preference polling, favorability ratings allow individuals to independently rate each candidate. This provides a comprehensive impression of a candidate's electorate appeal without vote splitting distortion, where votes divide between ideologically similar candidates in multi-candidate polls. Favorability indicates general candidate acceptance among voters, irrespective of final vote choice. The table uses net favorability (favorable minus unfavorable).
| Poll source | Date(s) administered |
Sample size[lower-alpha 2] | Doug Burgum |
Chris Christie |
Ron DeSantis |
Larry Elder |
Nikki Haley |
Asa Hutchinson |
Mike Pence |
Vivek Ramaswamy |
Tim Scott |
Donald Trump |
|---|---|---|---|---|---|---|---|---|---|---|---|---|
| Economist/YouGov | January 7-9, 2024 | 450 (A) | 66% | |||||||||
| Morning Consult | January 4-7, 2024 | 825 (LV) | −27% | 49% | 24% | −3% | 44% | 61% | ||||
| Economist/YouGov | Dec. 31 2023-Jan. 2 2024 | 440 (A) | −38% | 56% | 26% | −15% | 20% | 68% | ||||
| Morning Consult | December 28-30, 2023 | 837 (LV) | −19% | 39% | 16% | −7% | 29% | 60% | ||||
| Gallup | December 1-20, 2023 | 281 (A) | 39% | 20% | 60% |
Head-to-head polling
| Poll source | Date(s) administered |
Sample size |
Ron DeSantis |
Donald Trump |
Undecided/ Other | ||
|---|---|---|---|---|---|---|---|
| Noble Predictive Insights/The Center Square | October 20–26, 2023 | 925 (LV) | 32% | 68% | – | ||
| Echelon Insights | October 23–26, 2023 | 430 (LV) | 23% | 71% | 6% | ||
| Echelon Insights | March 27–29, 2023 | 370 (RV) | 34% | 59% | 7% | ||
| Harris Poll | March 22–23, 2023 | – | 44% | 56% | – | ||
| Premise | March 4–7, 2023 | 639 (RV) | 37% | 53% | 10% | ||
| Echelon Insights | February 17–23, 2023 | 419 (LV) | 42% | 53% | 5% | ||
| McLaughlin & Associates | February 17–23, 2023 | 441 (LV) | 38% | 56% | 6% | ||
| Big Village | February 15–17, 2023 | 346 (A) | 39% | 61% | – | ||
| Harris Poll | February 15–16, 2023 | – | 44% | 56% | – | ||
| WPA Intelligence | February 13–16, 2023 | 1,000 (RV) | 55% | 37% | 12% | ||
| Rasmussen Reports | February 8–12, 2023 | – | 32% | 45% | 23% | ||
| YouGov | February 2–6, 2023 | 453 (RV) | 45% | 41% | 14% | ||
| OnMessage | January 30 – February 5, 2023 | 1,000 (LV) | 53% | 38% | 9% | ||
| Monmouth University | January 26 – February 2, 2023 | 566 (RV) | 53% | 40% | 7% | ||
| Echelon Insights | January 23–25, 2023 | 467 (LV) | 48% | 43% | 9% | ||
| McLaughlin & Associates | January 19–24, 2023 | 457 (LV) | 41% | 52% | 7% | ||
| WPA Intelligence | January 17–23, 2023 | 3,015 (LV) | 49% | 40% | 11% | ||
| North Star Opinion Research | January 16–21, 2023 | 1,000 (LV) | 44% | 28% | 28% | ||
| 1,000 (LV) | 52% | 30% | 18% | ||||
| Big Village | January 18–20, 2023 | 355 (A) | 39% | 61% | – | ||
| Marquette University | January 9–20, 2023 | 352 (RV) | 64% | 36% | – | ||
| 401 (A) | 62% | 38% | – | ||||
| Harris Poll | January 18–19, 2023 | – | 45% | 55% | – | ||
| Schoen Cooperman Research | January 14–18, 2023 | – | 45% | 46% | 9% | ||
| YouGov | January 12–16, 2023 | 450 (RV) | 45% | 42% | 13% | ||
| Public Policy Polling | January 10–11, 2023 | 446 (LV) | 43% | 42% | 15% | ||
| YouGov | January 5–9, 2023 | 346 (A) | 51% | 49% | – | ||
| YouGov | December 15–19, 2022 | 390 (A) | 48% | 40% | 12% | ||
| 450 (RV) | 45% | 43% | 12% | ||||
| Harris Poll | December 14–15, 2022 | 666 (RV) | 52% | 48% | – | ||
| Echelon Insights | December 12–14, 2022 | 418 (RV) | 48% | 46% | 6% | ||
| 454 (LV) | 47% | 46% | 7% | ||||
| Morning Consult | December 10–14, 2022 | 825 (RV) | 45% | 44% | 9% | ||
| McLaughlin & Associates | December 9–14, 2022 | 480 (LV) | 36% | 58% | 6% | ||
| Suffolk University | December 7–11, 2022 | 374 (RV) | 56% | 33% | 11% | ||
| Fabrizio, Lee & Associates | December 3–7, 2022 | 267 (RV) | 52% | 38% | 10% | ||
| YouGov | December 1–5, 2022 | 435 (RV) | 47% | 42% | 11% | ||
| 521 (A) | 42% | 42% | 16% | ||||
| Marquette University | November 15–22, 2022 | 318 (A) | 60% | 40% | – | ||
| 383 (A) | 57% | 42% | – | ||||
| Quinnipiac University | November 16–20, 2022 | – | 45% | 43% | 13% | ||
| – | 44% | 44% | 12% | ||||
| Echelon Insights | November 17–19, 2022 | 424 (RV) | 40% | 52% | 8% | ||
| 424 (LV) | 46% | 46% | 8% | ||||
| YouGov | November 13–15, 2022 | 432 (A) | 46% | 39% | 15% | ||
| Léger | November 11–13, 2022 | 316 (A) | 45% | 43% | 12% | ||
| YouGov | November 9–11, 2022 | – | 42% | 35% | 23% | ||
| 2022 midterm elections | |||||||
| Echelon Insights | October 24–26, 2022 | 405 (RV) | 32% | 60% | 8% | ||
| 455 (LV) | 34% | 56% | 10% | ||||
| YouGov | October 11–26, 2022 | 1,720 (RV) | 45% | 55% | – | ||
| YouGov | October 13–17, 2022 | 473 (RV) | 36% | 45% | 19% | ||
| 570 (A) | 35% | 45% | 20% | ||||
| McLaughlin & Associates | October 12–17, 2022 | 454 (LV) | 29% | 64% | 7% | ||
| YouGov | September 23–27, 2022 | 456 (RV) | 34% | 46% | 20% | ||
| 573 (A) | 32% | 45% | 23% | ||||
| Echelon Insights | August 1 – September 7, 2022 | 490 (LV) | 35% | 57% | 8% | ||
| YouGov | September 2–6, 2022 | 467 (RV) | 37% | 49% | 14% | ||
| 547 (A) | 34% | 48% | 18% | ||||
| YouGov | August 18–22, 2022 | 460 (RV) | 31% | 49% | 20% | ||
| 547 (A) | 31% | 49% | 20% | ||||
| YouGov | July 28 – August 1, 2022 | 428 (LV) | 35% | 44% | 21% | ||
| 504 (A) | 34% | 44% | 22% | ||||
| Echelon Insight | July 15–18, 2022 | 408 (RV) | 30% | 59% | 11% | ||
| 431 (LV) | 32% | 56% | 12% | ||||
| YouGov | July 8–11, 2022 | 488 (RV) | 31% | 47% | 22% | ||
| 575 (A) | 29% | 50% | 21% | ||||
| YouGov | June 24–27, 2022 | 457 (RV) | 36% | 44% | 20% | ||
| 542 (A) | 33% | 45% | 27% | ||||
| Poll source | Date(s) administered |
Sample size |
Nikki Haley |
Donald Trump |
Undecided/ Other |
|---|---|---|---|---|---|
| Echelon Insights | October 23–26, 2023 | 430 (LV) | 21% | 73% | 6% |
| Noble Predictive Insights/The Center Square | October 20–26, 2023 | 925 (LV) | 27% | 73% | – |
| Poll source | Date(s) administered |
Sample size |
Mike Pence |
Donald Trump |
Undecided/ Other |
|---|---|---|---|---|---|
| Public Policy Polling | January 10–11, 2023 | 446 (LV) | 25% | 65% | 10% |
| Fabrizio, Lee & Associates | December 3–7, 2022 | 270 (RV) | 28% | 63% | 9% |
| YouGov | June 24–27, 2022 | 457 (RV) | 18% | 65% | 17% |
| 542 (A) | 18% | 61% | 21% | ||
| YouGov | June 24–27, 2022 | 457 (RV) | 18% | 65% | 17% |
| 542 (A) | 18% | 61% | 21% | ||
| Echelon Insights | April 18–20, 2022 | 436 (RV) | 25% | 68% | 7% |
| 459 (LV) | 28% | 64% | 8% |
| Poll source | Date(s) administered |
Sample size[lower-alpha 2] |
Margin of error |
Tucker Carlson |
Ted Cruz |
Ron DeSantis |
Nikki Haley |
Josh Hawley |
Larry Hogan |
Mike Pence |
Mike Pompeo |
Vivek Ramaswamy |
Mitt Romney |
Marco Rubio |
Tim Scott |
Donald Trump Jr. |
Other | Undecided | |||||||
|---|---|---|---|---|---|---|---|---|---|---|---|---|---|---|---|---|---|---|---|---|---|---|---|---|---|
| HarrisX/The Messenger | October 30–November 1, 2023 | 753 (RV) | – | – | – | 36% | 12% | – | – | – | – | 16% | – | – | 5% | – | 9%[lower-alpha 358] | 18% | |||||||
| HarrisX/The Messenger | August 24-28, 2023 | 685 (RV) | – | – | – | 33% | 6% | – | – | 12% | – | 23% | – | – | 3% | – | 9%[lower-alpha 359] | 14% | |||||||
| HarrisX/American Free Enterprise Chamber of Commerce | August 17–21, 2023 | 1,057 (LV) | – | – | – | 27% | 4% | – | – | 8% | – | 22% | – | – | 5% | – | 16%[lower-alpha 360] | 17% | |||||||
| Harvard/Harris | October 12–13, 2022 | 724 (RV) | – | – | 9% | 40% | 3% | – | – | 18% | 3% | – | – | 4% | 1% | – | 5% | 17% | |||||||
| Cygnal | October 10–12, 2022 | 1,204 (LV) | – | – | 4% | 46% | 4% | 0% | 1% | 17% | 2% | – | – | 2% | 1% | – | 11%[lower-alpha 361] | 14% | |||||||
| McLaughlin & Associates | September 17–22, 2022 | 465 (LV) | – | – | 6% | 31% | 3% | – | 2% | 11% | 3% | – | 2% | 2% | 1% | 19% | 13%[lower-alpha 362] | 12% | |||||||
| Echelon Insights | September 16–19, 2022 | 465 (LV) | – | – | 5% | 49% | 2% | 1% | 0% | 10% | 1% | – | 3% | 2% | 0% | 6% | 8%[lower-alpha 363] | 11% | |||||||
| Harvard/Harris | September 7–8, 2022 | 667 (RV) | – | – | 6% | 39% | 5% | – | – | 18% | 4% | – | – | 3% | 1% | – | 4% | 20% | |||||||
| McLaughlin & Associates | August 20–24, 2022 | 461 (LV) | – | – | 3% | 26% | 4% | – | 2% | 13% | 1% | – | 4% | 2% | 2% | 18% | 15%[lower-alpha 364] | 12% | |||||||
| Echelon Insights | August 19–22, 2022 | 459 (LV) | – | – | 5% | 41% | 5% | 0% | 1% | 10% | 0% | – | 1% | 1% | 0% | 11% | 7%[lower-alpha 365] | 17% | |||||||
| Harvard/Harris | July 27–28, 2022 | 679 (RV) | – | – | 7% | 34% | 7% | – | – | 19% | 3% | – | – | 3% | 1% | – | 3% | 22% | |||||||
| Echelon Insights | July 15–18, 2022 | 431 (LV) | – | – | 4% | 45% | 3% | 0% | 0% | 12% | 2% | – | 2% | 2% | 1% | 9% | 5%[lower-alpha 366] | 13% | |||||||
| Harvard/Harris | June 29–30, 2022 | 474 (RV) | – | – | 8% | 36% | 5% | – | – | 17% | 3% | – | – | 3% | 2% | – | 8% | 19% | |||||||
| McLaughlin & Associates | June 17–22, 2022 | 436 (LV) | – | – | 4% | 32% | 3% | – | 1% | 12% | 3% | – | 3% | 3% | 2% | 17% | 11%[lower-alpha 367] | 11% | |||||||
| Echelon Insights | June 17–20, 2022 | 409 (LV) | – | – | 6% | 39% | 3% | 1% | 0% | 18% | 0% | – | 3% | 2% | 0% | 7% | 5%[lower-alpha 368] | 15% | |||||||
| Zogby Analytics | May 23–24, 2022 | 408 (LV) | ± 4.9% | – | 12% | 27% | 4% | – | – | 23% | 3% | – | – | 5% | – | – | 13%[lower-alpha 369] | 15% | |||||||
| Echelon Insights | May 20–23, 2022 | 451 (LV) | – | – | 7% | 34% | 3% | 1% | 1% | 17% | 0% | – | 1% | 2% | 1% | 17% | 8%[lower-alpha 370] | 18% | |||||||
| Harvard/Harris | May 18–19, 2022 | – | – | – | 9% | 25% | 5% | – | – | 15% | 2% | – | – | 3% | 2% | – | 9% | 29% | |||||||
| McLaughlin & Associates | April 22–26, 2022 | 464 (LV) | – | – | 6% | 31% | 2% | – | 1% | 11% | 1% | – | 4% | 3% | 1% | 16% | 12%[lower-alpha 371] | 13% | |||||||
| Harvard/Harris | April 20–21, 2022 | 708 (RV) | – | – | 8% | 35% | 7% | – | – | 20% | 1% | – | – | 3% | 1% | – | 6% | 18% | |||||||
| Echelon Insights | April 18–20, 2022 | 459 (LV) | – | – | 7% | 35% | 6% | 0% | 2% | 15% | 2% | – | 2% | 3% | 1% | 5% | 4%[lower-alpha 372] | 17% | |||||||
| Harvard/Harris | March 23–24, 2022 | 719 (RV) | – | – | 10% | 28% | 6% | – | – | 24% | 3% | – | – | 5% | 2% | – | 5% | 16% | |||||||
| McLaughlin & Associates | March 17–22, 2022 | 459 (LV) | – | – | 5% | 26% | 4% | – | 1% | 15% | 2% | – | 3% | 2% | 1% | 16% | 7%[lower-alpha 373] | 17% | |||||||
| Echelon Insights | March 18–21, 2022 | 475 (LV) | – | – | 5% | 31% | 6% | 1% | 1% | 16% | 1% | – | 6% | 3% | 1% | 8% | 3%[lower-alpha 374] | 17% | |||||||
| Harvard/Harris | February 23–24, 2022 | 729 (RV) | – | – | 11% | 33% | 5% | – | – | 25% | 5% | – | – | 4% | 3% | – | 14% | – | |||||||
| Echelon Insights | February 19–23, 2022 | 451 (LV) | – | – | 8% | 27% | 5% | 1% | 1% | 18% | 2% | – | 2% | 3% | 1% | 7% | 10%[lower-alpha 375] | – | |||||||
| McLaughlin & Associates | February 16–22, 2022 | 463 (LV) | – | – | 5% | 27% | 3% | – | 0% | 11% | 2% | – | 3% | 2% | 1% | 17% | 14%[lower-alpha 376] | 13% | |||||||
| Morning Consult/Politico | January 22–23, 2022 | 463 (RV) | – | – | 6% | 25% | 4% | – | 1% | 12% | 1% | – | 2% | 1% | 1% | 24% | 6%[lower-alpha 377] | – | |||||||
| Echelon Insights | January 21–23, 2022 | 423 (RV) | – | – | 6% | 28% | 4% | 0% | 1% | 16% | 0% | – | 6% | 1% | 2% | 11% | 6%[lower-alpha 378] | – | |||||||
| Harvard/Harris | January 19–20, 2022 | 1815 (RV) | – | – | 14% | 30% | 4% | – | – | 25% | 3% | – | – | 6% | 3% | – | – | – | |||||||
| McLaughlin & Associates | January 13–18, 2022 | 468 (LV) | – | – | 8% | 26% | 6% | – | 0% | 12% | 1% | – | 5% | 1% | 1% | 18% | 7%[lower-alpha 379] | 13% | |||||||
| Echelon Insights | December 9–13, 2021 | 439 (RV) | – | – | 8% | 30% | 3% | 1% | 0% | 12% | 1% | – | 4% | 2% | 1% | 8% | 8%[lower-alpha 380] | 19% | |||||||
| Harvard/Harris | November 30 – December 2, 2021 | 1989 (RV) | – | – | 13% | 30% | 7% | – | – | 25% | 4% | – | – | 8% | 4% | – | 10% | – | |||||||
| Echelon Insights | November 12–18, 2021 | 435 (RV) | – | – | 10% | 26% | 6% | 1% | 0% | 15% | 1% | – | 3% | 1% | 1% | 13% | 5%[lower-alpha 381] | 20% | |||||||
| Harvard/Harris | October 26–28, 2021 | 490 (LV) | ±4.0% | – | 12% | 21% | – | – | – | 23% | – | – | – | – | – | – | 0% | 43% | |||||||
| Echelon Insights | October 15–19, 2021 | 476 (RV) | – | 2% | 8% | 22% | 5% | 0% | 0% | 8% | 2% | – | 3% | 4% | 2% | 13% | 8%[lower-alpha 382] | 22% | |||||||
| McLaughlin & Associates | October 14–18, 2021 | 463 (LV) | – | – | 5% | 24% | 5% | – | – | 14% | 1% | – | 5% | 2% | 2% | 18% | 11%[lower-alpha 383] | 13% | |||||||
| Echelon Insights | September 17–23, 2021 | 479 (RV) | – | 2% | 9% | 22% | 6% | 1% | 1% | 15% | 2% | – | 4% | 2% | 1% | 9% | 11%[lower-alpha 384] | 21% | |||||||
| Harvard/Harris | September 15–16, 2021 | 490 (LV) | ±4.0% | – | 14% | 20% | – | – | – | 32% | – | – | – | – | – | – | 0% | 38% | |||||||
| McLaughlin & Associates | September 9–14, 2021 | 456 (LV) | – | – | 7% | 22% | 4% | – | – | 15% | 2% | – | 4% | 2% | 2% | 19% | 12%[lower-alpha 385] | 11% | |||||||
| Emerson College | August 30 – September 1, 2021 | 395 (RV) | ± 4.9% | – | 13% | 32% | 10% | 6% | – | 24% | – | – | 6% | – | – | – | 9%[lower-alpha 386] | 0% | |||||||
| McLaughlin & Associates | July 29 – August 3, 2021 | 467 (LV) | – | – | 9% | 23% | 4% | – | – | 11% | 2% | – | 4% | 4% | 1% | 12% | 16%[lower-alpha 387] | 14% | |||||||
| Echelon Insights | July 19–23, 2021 | 421 (RV) | – | 1% | 9% | 32% | 4% | 1% | 0%[lower-alpha 41] | 17% | 1% | – | 3% | 2% | 1% | 10% | 6%[lower-alpha 388] | 13% | |||||||
| Fabrizio, Lee & Associates | July 6–8, 2021 | 800 (RV) | ± 3.5% | – | 7% | 39% | 4% | 0% | 1% | 15% | 1% | – | 3% | – | 2% | – | 4%[lower-alpha 389] | 24% | |||||||
| Echelon Insights | June 18–22, 2021 | 386 (RV) | – | 1% | 6% | 21% | 6% | 0%[lower-alpha 41] | 0%[lower-alpha 41] | 14% | 0%[lower-alpha 41] | – | 4% | 3% | 2% | 7% | 7%[lower-alpha 390] | 26% | |||||||
| McLaughlin & Associates | June 16–20, 2021 | 444 (LV) | – | – | 6% | 24% | 4% | – | – | 19% | 1% | – | 5% | 2% | 1% | 15% | 13%[lower-alpha 391] | 11% | |||||||
| McLaughlin & Associates | May 12–18, 2021 | 444 (LV) | – | 1% | 12% | 18% | 5% | – | – | 19% | 2% | – | 3% | 1% | 2% | 13% | 13%[lower-alpha 392] | 12% | |||||||
| Echelon Insights | May 14–17, 2021 | 479 (RV) | – | 2% | 9% | 22% | 5% | 1% | 0%[lower-alpha 41] | 14% | 1% | – | 4% | 1% | 3% | 6% | 9%[lower-alpha 393] | 19% | |||||||
| Trafalgar Group | April 30 – May 6, 2021 | – (LV)[lower-alpha 394] | – | – | 15% | 35% | 6% | 1% | – | 10% | – | – | 10% | – | – | – | 21%[lower-alpha 395] | – | |||||||
| Echelon Insights | April 16–23, 2021 | 440 (RV) | – | 2% | 8% | 20% | 6% | 1% | 0%[lower-alpha 41] | 16% | 1% | – | 4% | 2% | 0%[lower-alpha 41] | 9% | 3%[lower-alpha 396] | 28% | |||||||
| McLaughlin & Associates | April 8–13, 2021 | 441 (LV) | – | 3% | 10% | 14% | 3% | – | – | 19% | 2% | – | 3% | 3% | 1% | 15% | 13%[lower-alpha 397] | 14% | |||||||
| Echelon Insights | March 15–21, 2021 | 1,008 (RV) | – | 4% | 5% | 17% | 4% | – | – | 16% | 4% | – | 3% | 2% | – | 3% | 7%[lower-alpha 398] | 35% | |||||||
| Fabrizio, Lee & Associates/The Hill | February 20 – March 2, 2021 | 1,264 (LV) | ± 2.7% | – | 13% | 17% | 8% | 2% | 1% | 19% | 4% | – | 5% | 4% | 1% | – | 7%[lower-alpha 399] | 20% | |||||||
| McLaughlin & Associates | Feb 24–28, 2021 | 448 (LV) | – | 1% | 9% | 9% | 5% | – | – | 15% | – | – | 6% | 2% | – | 21% | 16%[lower-alpha 400] | 17% | |||||||
| RMG Research/Just the News | February 25–27, 2021 | 363 (RV) | – | 8% | 18% | 21% | 10% | 2% | – | – | 9% | – | – | – | – | – | 33%[lower-alpha 401] | – | |||||||
| Harvard/Harris | February 23–25, 2021 | 546 (RV) | – | – | 16% | – | 10% | 6% | – | 41% | – | – | – | – | 7% | – | 19%[lower-alpha 402] | – | |||||||
| Echelon Insights | February 12–18, 2021 | 430 (RV) | – | 1% | 10% | 8% | 6% | ≤1% | 1% | 21% | 1% | – | 4% | ≤1% | ≤1% | 8% | 12%[lower-alpha 403] | 26% | |||||||
| Echelon Insights | January 20–26, 2021 | – (RV)[lower-alpha 404] | – | 2% | 8% | 2% | 9% | 0% | 0% | 21% | 1% | – | 3% | 2% | 1% | 10% | 10%[lower-alpha 405] | 30% | |||||||
| Inauguration of Joe Biden | |||||||||||||||||||||||||
| Léger | January 15–17, 2021 | 1,007 (A)[lower-alpha 406] | ± 3.09% | – | 9% | 3% | 8% | 2% | 7% | 22% | 3% | – | 20% | 4% | 3% | 11% | 8%[lower-alpha 407] | – | |||||||
| McLaughlin & Associates/Newsmax | November 21–23, 2020 | 442 (LV) | ± 3.1% | 1% | 7% | 2% | 6% | – | – | 20% | 1% | – | 5% | 3% | 2% | 20% | 13%[lower-alpha 408] | 22% | |||||||
| Léger | November 13–15, 2020 | 304 (A)[lower-alpha 409] | ± 3.1% | 6% | 14% | – | 6% | – | – | 44% | 3% | – | 11% | 6% | – | – | 7%[lower-alpha 410] | – | |||||||
| 2020 presidential election | |||||||||||||||||||||||||
| McLaughlin & Associates | November 2–3, 2020 | 449 (LV) | – | 2% | 5% | 2% | 8% | – | – | 30% | – | – | 5% | 2% | 1% | 20% | 5%[lower-alpha 411] | 21% | |||||||
| Echelon Insights | August 14–18, 2020 | 423 (LV) | – | 2% | 4% | – | 7% | 0% | 1% | 26% | – | – | – | 5% | 1% | 12% | 11%[lower-alpha 412] | 29% | |||||||
| Léger | August 4–7, 2020 | 309 (LV) | ± 2.8% | 7% | 8% | – | 11% | – | – | 31% | 3% | – | 9% | 5% | – | 17% | 9%[lower-alpha 413] | – | |||||||
Statewide polling
See also
Notes
- ↑ Calculated by taking the difference of 100% and all other candidates combined.
- 1 2 3 Key:
A – all adults
RV – registered voters
LV – likely voters
V – unclear - ↑ Someone Else at 0%; Not Sure at 6%; Would Not Vote at 1%
- ↑ Others/Don't Know at 22%
- ↑ Someone Else at 3%; Not Sure at 7%
- ↑ Binkley at 0%; Someone Else at 2%; None of These at 3%
- ↑ Someone Else at 0%; Not Sure at 6%; Would Not Vote at 2%
- ↑ Undecided at 8%
- ↑ Someone Else at 1%; Not Sure at 6%; Would Not Vote at 1%
- ↑ Someone Else at 0%; Would Note Vote at 1%; Undecided at 2%
- ↑ Not Sure at 13%; Would Not Vote at 1%
- ↑ Someone Else at 0%; Unsure at 5%
- ↑ Someone Else at 1%; Don't Know at 5%
- ↑ Someone Else at 1%; Not Sure at 8%; Would Not Vote at 2%
- ↑ "No opinion" with 3%; "Someone else" with 1%
- ↑ None of These at 0%; Don't Know at 5%
- ↑ Someone Else at 1%
- ↑ Binkley at 0.8%; Someone Else at 1.8%
- ↑ Someone Else at 5%; Not Sure at 8%
- ↑ Binkley and Stapleton at 0%; Someone Else at 1%; Don't Know at 8%
- ↑ Would Not Vote at 0.5%; Someone Else at 2.0%; Not Sure at 6.2%
- ↑ Cheney at 3%; Someone Else at 1%; Don't Know at 11%
- ↑ Someone Else at 1%
- ↑ Undecided at 9.7%
- ↑ Undecided at 9%
- ↑ Binkley and Stapleton at 0%; Someone Else at 2%; Don't Know at 7%
- ↑ Binkley, Hurd, and Perry Johnson at 0%; Someone Else at 1%; Don't Know at 6%
- ↑ someone else at 1%; not sure at 6%; would not vote at 1%
- ↑ Other at 0%; None at 2%; Would Not Vote at 1%
- ↑ Not Sure at 11%; Would Not Vote at 2%
- ↑ "Undecided" with 2%; "Someone else" with 1%
- ↑ Someone Else at 1%
- ↑ Binkley at 0%
- ↑ Undecided at 16%
- ↑ Undecided at 11%
- ↑ Someone else at 1%
- ↑ Undecided at 5.4%
- ↑ Binkley at 0.7%; Someone Else at 2.6%
- ↑ "Someone else with 2%; "No opinion with 1%
- ↑ Someone Else at 1%; Binkley and Stapleton at 0%; Undecided at 7%
- 1 2 3 4 5 6 7 8 9 10 11 No voters
- ↑ Someone Else and Would Not Vote with 1%; Undecided with 10%
- ↑ Another Candidate at 6.2%; Not Sure at 4.3%
- ↑ Someone Else with 1%; Would Not Vote and Refused with 0%; Undecided with 4%
- ↑ Cheney at 2%; Someone Else at 1%; Undecided at 8%
- ↑ Someone Else at 2%
- ↑ Someone Else with 0%; Undecided with 8%
- ↑ Perry Johnson at 1%; Undecided at 10%
- ↑ Someone Else and None of These Candidates at 1%; Binkley and Perry Johnson at 0%
- ↑ Binkley, Perry Johnson, and Stapleton at 0%; Someone Else at 1%; Don't Know at 7%
- ↑ Someone Else at 1%
- ↑ Binkley and Perry Johnson at 0.0%; Undecided at 8.4%; Refused at 1.0%
- ↑ Binkley, Hurd and Perry Johnson at 0%; Someone Else at 1%; Unsure at 6%
- ↑ Perry Johnson at 1.2%; Undecided at 9.7%
- ↑ Not Sure at 9%; Would Not Vote at 1%
- ↑ Cheney at 2%; Pompeo at 0%; Other at 2%
- ↑ Someone Else at 1.1%; Not Sure at 7.8%
- ↑ Someone Else at 1%
- ↑ Someone Else at 6%; Undecided at 1%
- ↑ Hurd and Perry Johnson at 0%; Someone Else at 1%; No Opinion at 1%
- ↑ Hurd at 0%; Other at 1%
- ↑ Perry Johnson, Binkley, Hurd and Stapleton at 0%; Someone Else at 0%; Don't Know at 5%
- ↑ Perry Johnson at 0.7%; Binkley at 0.0%; Undecided at 6.9%
- ↑ Someone Else at 0%; Undecided at 3%
- ↑ Hurd at 0%; Someone Else at 1%; Not Sure at 7%; Would Not Vote at 3%
- ↑ Binkley at 0.4%; Perry Johnson at 0.2%; Someone Else at 1.9%
- ↑ Cheney at 3%; Pompeo at 1%; Other at 2%
- ↑ Hurd at 0%; Someone Else at 1%
- ↑ "No opinion" at 8%; Binkley, Hurd and Perry Johnson at 0%
- ↑ Hurd at 1%; Youngkin at 0.8%; Suarez at 0.1%
- ↑ Don't know/Unsure at 5%; Someone else at 1%; Binkley, Hurd, Perry and Stapleton at 0%
- ↑ Someone Else at 1%; Not Sure at 10%; Hurd at 0%
- ↑ Cheney at 1%; Someone Else at 2%; Don't know at 6%
- ↑ Hurd at 0%; Someone Else at 1%; Unsure at 3%
- ↑ Hurd at 0%; Someone Else at 1%; Not Sure at 10%; Would Not Vote at 4%
- ↑ Undecided at 6%; Hurd and Perry Johnson at 1%
- ↑ Hurd at 0%; Undecided at 16%
- ↑ Hurd at 0%; Someone Else at 1%
- ↑ Other at 3%; Don't Know at 20%
- ↑ Perry Johnson at 1.1 %; Binkley at 0.2%; Hurd at 0.1%; Undecided at 3.1%
- ↑ Other at 4%; No Opinion at 6%
- ↑ Other at 1%; None at 2%; Would Not Vote at 1%
- ↑ Binkley, Hurd and Stapleton at 1%; Perry Johnson at 0%; Suarez at 0%; Someone Else at 1%; Don't Know at 7%
- ↑ Hurd at 1.3%; Perry Johnson at 0.1%; Undecided at 5.2%
- ↑ Not Sure at 9%; Would Not Vote at 2%
- ↑ Other at 7%
- ↑ Hurd at 0%; Someone Else at 1%
- ↑ Perry Johnson at 1%; Binkley and Hurd at 0%; Someone Else at 1%; Don't Know at 9%
- ↑ Cheney and Youngkin at 1%; Hurd at 0%; Don't Know at 7%; None at 1%; Other at 0%
- ↑ Hurd at 0%; Someone Else 1%; Not Sure at 6%; Would Not Vote 5%
- ↑ Undecided at 3%, Refused at 1%
- ↑ Hurd and Perry Johnson at 1% Binkley at 0%; Stapleton at 0%; Suarez at 0%; Someone Else at 1%; Unsure at 7%
- ↑ Hurd at 0%; Someone Else at 1%
- ↑ Cheney at 3%; Cruz at 2%; Pompeo at 1%; Other at 1%
- ↑ Binkley, Hurd and Perry Johnson at 0%; Suarez at 0%
- ↑ Perry Johnson at 0%; Suarez at 0%; Someone Else at 1%
- ↑ Hurd at 0%; Someone Else at 1%
- ↑ Hurd at 0%; Someone Else at 7%
- ↑ Hurd and Suarez at 0%; Someone Else at 1%; Unsure at 5%
- ↑ Hurd, Perry Johnson and Suarez at 0%; Someone Else at 1%; No Opinion at 1%
- ↑ Hurd, Perry Johnson and Suarez at 0%; Undecided at 4%
- ↑ Hurd and Suarez at 0%; Someone Else at 1%
- ↑ Hurd and Suarez at 0%; Someone Else at 1%; Not Sure at 11%; Would Not Vote at 6%
- ↑ Hurd at 0.7%; Youngkin at 0.4%; Suarez at 0.3%
- ↑ Binkley, Hurd and Perry Johnson at 0%; Suarez at 0%; Someone Else and Stapleton at 0%; Undecided at 6%
- ↑ Perry Johnson at 1.2%; Binkley at 0.5%; Someone Else at 1.5%
- ↑ Perry Johnson at 0.4%; Hurd and Suarez at 0.3%; Undecided at 7.6%
- ↑ Hurd at 1%; Suarez at 0%; Don't Know at 16%
- ↑ Uncertain at 8%
- ↑ Hurd and Suarez at 0%; Someone Else at 1%
- ↑ Unsure at 3.8%
- ↑ Hurd at 0.9%; Binkley and Suarez at 0.2%; Perry Johnson at 0%; No Opinion at 5.7%
- ↑ Cheney and Hurd at 0%; Don't Know at 9%; Someone Else at 2%
- ↑ Hurd, Perry Johnson and Suarez at 0%; Undecided at 11%
- ↑ Binkley, Hurd, Perry Johnson and Suarez at 0%
- ↑ Suarez at 0%; Not Sure at 14%; Would Not Vote at 2%
- ↑ Cheney and Cruz at 2%; Pompeo at 1%; Other at 3%
- ↑ Binkley at 1%; Hurd, Perry Johnson, Stapleton and Suarez at 0%; Someone Else at 2%; Unsure at 9%
- ↑ Hurd at 1.1%; Perry Johnson at 0.6%; Binkley at 0.2%; Suarez at 0.1%; No Opinion at 11.5%
- ↑ Hurd and Suarez at 0%; Someone Else at 1%
- ↑ Hurd and Suarez at 0%
- ↑ Hurd at 0.7%; Perry Johnson at 0.3%; Undecided at 10.8%
- ↑ Binkley, Hurd, Perry Johnson and Suarez at 0%; Undecided at 6%
- ↑ Perry Johnson at 1.1%; Someone Else at 2.3%; Undecided at 7.6%
- ↑ Hurd at 0.4%; Suarez at 0.3%; Perry Johnson at 0.1%; Undecided at 12%
- ↑ Suarez at 2%; Undecided at 9%
- ↑ Perry Johnson at 1.1%; Hurd at 0.3%; Binkley at 0.2%; Suarez at 0.1%; Undecided at 2.0%
- ↑ Hurd and Suarez at 0%; Someone Else 1%; Not Sure at 11%; Would Not Vote 4%
- ↑ Hurd, Perry Johnson and Suarez at 0%
- ↑ Hurd at 1%; Cheney, Cruz, Hogan, Perry Johnson, Noem, Pompeo, Suarez, Sununu, and Youngkin at 0%; Someone Else at 0%; Wouldn't Vote at 0%; Undecided at 4%; Refused at 1%
- ↑ Suarez at 1%; Hurd at 0%; Someone Else at 1%
- ↑ Uncertain at 13%
- ↑ Cheney and Cruz at 2%; Pompeo at 0%; Other at 2%
- ↑ Hurd at 0%; Other at 0%; Don't Know at 6%
- ↑ Hurd and Suarez at 0%; Someone Else at 1%
- ↑ Someone Else at 1%; Not Sure at 9%
- ↑ Youngkin at 1%; Cheney, Hurd and Suarez at 0%; Other at 1%; None at 1%; Don't Know at 14%
- ↑ Suarez at 0.6%; Binkley at 0.2%; Perry Johnson at 0%; Other at 0%; Undecided at 8.8%
- ↑ Hurd at 1%; Suarez at 0%; Someone else at 1%
- ↑ Hurd and Suarez at 0%; Someone Else at 1%; Unsure at 4%
- ↑ Hurd, Perry Johnson and Suarez at 0%; Someone Else at 1%; Don't Know at 13%
- ↑ Perry Johnson at 0.7%; Binkley at 0.1%; Someone Else at 1.7%
- ↑ Cheney and Cruz at 2%; Pompeo at 1%; Other at 4%
- ↑ Hurd and Suarez at 0%; Someone Else at 1%; Not Sure at 9%; Would Not Vote at 3%
- ↑ Cheney at 2%; Hurd, Perry Johnson and Romney at 1%; Perry at 0%; Suarez at 0%; Undecided at 9%
- ↑ Hurd and Suarez at 0%; Someone else at 1%
- ↑ Perry Johnson at 0%; Other at 1%; Undecided at 9%
- ↑ Binkley at 1%; Hurd, Perry Johnson and Suarez at 0%; Someone Else at 1%; Unsure at 8%
- ↑ Perry Johnson at 1%; Hurd and Suarez at 0%; None of These at 2%; Don’t Know at 4%
- ↑ Suarez at 0%; Unsure at 12%; Would Not Vote at 1%
- ↑ Hurd and Suarez at 0%; Undecided at 3%
- ↑ Cheney and Sununu at 1%; Hurd, Youngkin and Suarez at 0%; Other at 1%; None at 1%; Don't Know at 7%
- ↑ Hurd and Suarez at 0%; Someone else at 1%
- ↑ Cheney at 2%; Cruz and Pompeo at 1%; Other at 5%
- ↑ Hurd and Suarez at 0%; Someone Else at 2%; Not Sure at 10%; Would Not Vote at 1%
- ↑ Hurd and Suarez at 0%; Someone else at 1%
- ↑ Not sure at 9%
- ↑ Suarez at 1%; Hurd, Perry and Youngkin at 0%; Unsure at 6%
- ↑ Hurd and Suarez at 0%; Don't Know at 3%, None of the above 1%
- ↑ Hurd and Suarez at 0%; Someone Else at 1%
- ↑ Someone Else at 2%
- ↑ None at 3%; Other at 0%
- ↑ Suarez at 0%; Not Sure at 9%; Would Not Vote at 1%
- ↑ Someone Else at 1%
- ↑ Cheney and Suarez at 1%; Perry Johnson and Rick Perry at 0%; Undecided at 7%
- ↑ Someone else and no opinion at 1%
- ↑ Unsure at 7%
- ↑ Someone Else at 2%; Unsure at 9%
- ↑ Perry Johnson at 0.5%; Binkley at 0.4%; Someone Else at 2.1%
- ↑ Not Sure at 11%, Would Not Vote at 3%
- ↑ Someone else at 1%
- ↑ Others/Undecided at 17%
- ↑ Cheney at 2%; Abbot, Noem, and someone else at 1%
- ↑ Others/Undecided at 10%
- ↑ Liz Cheney at 4%; Ted Cruz at 3%; Mike Pompeo at 1%; Other at 3%
- ↑ Someone Else at 5%
- ↑ Cheney at 2%; Abbott, Noem, and Someone Else at 1%
- ↑ Romney at 3%; Cheney and Perry at 1%; Abbott, Bolton, Sununu, and Youngkin at 0%; Undecided at 8%
- ↑ Cheney at 2%; Abbott, Noem, Sununu, and Youngkin at 1%; Suarez at 0%; Others/Undecided at 6%
- ↑ Youngkin, Sununu, Noem, Cheney, at 1%; Perry Johnson at 0%; Undecided at 4%
- ↑ Cheney at 2%; Abbott and Someone Else at 1%; Noem at 0%; Undecided at 2%
- ↑ Chris Sununu at 1%; No opinion at 1%
- ↑ Cruz at 3%; Rubio at 1%; Other/Undecided at 8%
- ↑ Other at 0.0%; Undecided at 11.3%
- ↑ Chris Sununu at 1%; Undecided at 16%
- ↑ Others/Undecided at 5%
- ↑ Sununu at 1%; Others/Undecided at 14%
- ↑ Cheney at 2%; Abbott at 1%; Noem at 0%, Someone Else at 2%
- ↑ Liz Cheney at 2%; Greg Abbott and Kristi Noem at 1%
- ↑ Others/Undecided at 10%
- ↑ Other/Undecided at 5%
- ↑ Cruz at 3%, Cheney at 1%, Pompeo at 0%, Other at 3%
- ↑ Cheney and at 2%; Abbott, Noem, and Someone Else at 1%
- ↑ Someone else at 4%
- ↑ Cheney at 2%
- ↑ Sununu at 1%; Others/Undecided at 17%
- ↑ Cheney at 3%; Abbot, Noem, Youngkin, and someone else at 1%
- ↑ Undecided at 14.5%
- ↑ Cruz and Rubio at 1%, Someone Else at 2%
- ↑ Others at 2%
- ↑ Noem, Youngkin, Sununu at 1%, Others/Undecided at 14%
- ↑ Cheney at 2%; Abbot, Noem, and Undecided at 1%
- ↑ Cheney at 3%; Abbot, Noem, Pompeo, and Undecided at 1%
- ↑ Cheney at 3%, Pompeo and Youngkin at 1%, Sununu at 0%, Other at 0%
- ↑ Cheney at 3%; Pompeo and Sununu at 1%, Youngkin at 0%, Other at 1%
- ↑ Cheney 2%; Abbot, Pompeo, at 1%, others 1%.
- ↑ Cheney at 10.3%, Pompeo at 1.1%, Youngkin at 0.5%, Sununu at 0.1%
- ↑ Noem, Pompeo, Sununu at 1%, Youngkin at 0%, Someone Else at 0%
- ↑ Pompeo at 2%, Cheney, Hogan, and Youngkin at 0%
- ↑ Noem at 1%, Hawley, Pompeo, R. Scott, Sununu, Youngkin at 0%, Someone Else at 1%
- ↑ Cheney at 3%; Abbott, Noem, Pompeo, Youngkin at 1%
- ↑ Noem at 1.5%, Pompeo at 1.2%, Perry Johnson at 0.4% Undecided at 14.0%
- ↑ Cheney at 3%, Abbott at 2%, Noem, Pompeo, and Sununu at 1%, Suarez and Youngkin at 0%, Other at 1%
- ↑ Cheney at 3%; Abbott at 2%; Noem, Pompeo, Sununu at 1%
- ↑ Cruz and Noem at 2%; Pompeo, Youngkin, and Sununu at 1%; Perry Johnson at 0%
- ↑ Cruz at 2%, Pompeo and Rubio at 1%, Someone Else at 2%
- ↑ Cruz, Paul, and Rice at 1%, Pompeo at <1%, Others at 3%
- ↑ Liz Cheney at 3%; Greg Abbott, Kristi Noem, Mike Pompeo, Glenn Youngkin at 1%
- ↑ Someone else at 10.4%
- ↑ Cheney and Cruz at 2%; Noem, Pompeo, and Sununu at 1%; Perry Johnson and Youngkin at 0%; Undecided at 5%
- ↑ Chris Sununu at 2%, Mike Pompeo and Glenn Youngkin at 1%; Someone else at 3%; "No opinion" at 1%
- ↑ Ted Cruz at 4%; Liz Cheney at 3%, Other at 4%
- ↑ Liz Cheney at 2%; Greg Abbott, Kristi Noem, Mike Pompeo, and Glenn Youngkin at 1%
- ↑ Pompeo at 3%; Cheney at 1%; Hogan and Youngkin at 0%, Not Sure at 15%
- ↑ Cruz at 2%, Pompeo at 1%, Rubio at 0%, Unsure at 17%
- ↑ Hogan, Noem, and Pompeo at 1%, Sununu at 0%, Someone Else at 4%
- ↑ Liz Cheney at 3%; Abbott, Noem, Pompeo at 1%; Youngkin at 0%
- ↑ Romney at 3%, Cheney and Pompeo at 2%, Abbott, Bolton, Hogan, Sununu, and Youngkin at 1%, Undecided at 9%
- ↑ Abbott and Liz Cheney at 2%; Noem, Pompeo, Youngkin at 1%; Hogan, Suarez and Sununu at 0%, Others at 5%
- ↑ Noem at 1%
- ↑ Someone Else at 10.8%
- ↑ Pompeo at 3%, Rubio at 2%, Cruz at 1%, Someone Else at 1%, Unsure at 9%
- ↑ Noem at 1%
- ↑ Undecided at 5%
- ↑ Pompeo at 4%, Cruz at 2%, Cheney at 1%, Hogan, Noem, Sununu, and Youngkin at 0%, Undecided at 4%
- ↑ Noem at 1%
- ↑ Cheney at 1.9%, Pompeo at 1.8%, Hogan at 1.2%, Youngkin at 0.6%, Sununu at 0.5%, Other at 0.6%
- ↑ Noem at 1%
- ↑ Noem at 1%
- ↑ Pompeo at 3%, Cruz, Hogan, Noem, and Rubio at 1%, Other at 2%, Undecided at 11%
- ↑ Noem at 1%
- ↑ Cruz, Paul, and Pompeo at 1%, Others at 4%
- ↑ Noem at 1%
- ↑ Noem at 1%
- ↑ Noem at 1%
- ↑ Romney at 2%; Bolton, Gabbard, Hawley, Noem Rick Scott and Suarez at 0%
- ↑ Cheney at 3%, Kasich and Romney at 2%, Hogan, Pompeo, and Youngkin at 1%, Abbott, Bolton, Rubio, and Sununu at 0%, Undecided at 8%
- ↑ Noem at 1%
- ↑ Cheney at 3.6%, Cruz at 3.4%, Hogan at 0.7%, Hawley at 0.4%, Someone Else at 2.1%
- ↑ Cheney at 4%, Noem, Hogan, Sununu, and Youngkin at 1%, Would Not Vote at 1%, Undecided at 13%
- ↑ Cruz at 3.5%, Cheney at 2.7%, Sununu at 1.1%, Youngkin at 0.8%, Someone Else at 2.2%
- ↑ Rubio at 3%
- ↑ Cotton at 1%
- ↑ Noem at 1%
- ↑ Noem at 1%
- ↑ Cruz at 2%, Youngkin at 0%, someone else at 1%
- ↑ Noem at 1%
- ↑ Noem at 1%
- ↑ Cruz at 3%, Abbott, Carlson, and Cheney at 2%; Pompeo and Youngkin at 1%, Bolton, Hogan, and Sununu at 0%, Someone Else at 3%
- ↑ Noem at 0%
- ↑ Noem at 0%
- ↑ Noem at 0%
- ↑ Noem at 1%
- ↑ Noem at 1%
- ↑ Noem at 1%
- ↑ Noem at 1%
- ↑ Christie at 1%
- ↑ Noem at 0%
- ↑ Noem at 1%
- ↑ Noem, Romney, Christie and Gabbard at 1%; Bolton, Hawley, Kemp, Suarez and Rick Scott at 0%
- ↑ Kristi Noem at 2%; Rick Scott, Romney, Christie and Gabbard at 1%; Hawley, Kemp, Suarez and Bolton at 0%
- ↑ Christie at 1%; Bolton, Kemp, Noem, Hutchinson, Hawley, Rick Scott and Crenshaw at 0%
- ↑ Noem at 0%
- ↑ Mitt Romney at 2%; Kasich and Bolton at 1%
- ↑ Noem at 1%
- ↑ Noem at 1%
- ↑ Noem at 1%
- ↑ Chris Christie at 3%
- ↑ Chris Christie at 2%
- ↑ Noem at 1%
- ↑ Donald Trump Jr. at 9%
- ↑ Chris Christie at 4%
- ↑ Marjorie Taylor Greene at 1%; Bolton at 0%
- ↑ Mitt Romney at 2%; Hawley at 1%; Noem, Rick Scott and Christie at 0%
- ↑ Hawley at 0%
- ↑ Romney at 1%; Gabbard, Bolton, Suarez, Noem, Hawley, Christie and Rick Scott at 0%
- ↑ Romney at 1%; Bolton, Gabbard, Suarez, Noem, Hawley, Christie and Rick Scott at 0%
- ↑ Mitt Romney at 2%; Cotton at 1%; Christie, Rick Scott, Noem and Hawley at 0%
- ↑ Kristi Noem at 2%; Tucker Carlson at 1%
- ↑ Mitt Romney at 2%; Cotton and Noem at 1%; Rick Scott and Hawley at 0%
- ↑ Mitt Romney at 2%; Christie at 1%; Cotton, Noem and Rick Scott at 0%
- ↑ Tom Cotton at 4%; Romney, Bolton and Kasich at 1%
- ↑ Cotton, Hutchinson, Hawley, Crenshaw, Kemp, Noem, Christie and Rick Scott at 0%
- ↑ Mitt Romney at 2%; Cotton and Kasich at 1%; Owens, Rick Scott and Noem at 0%
- ↑ Mitt Romney and John Bolton at 2%; Cotton and Kasich at 1%; Owens, Rick Scott and Noem at 0%
- ↑ Mitt Romney at 3%; Cotton, Christie and Noem at 1%; Hawley at 0%
- ↑ Cotton, Hawley and Noem at 1%; Rick Scott, Stefanik and Christie at 0%
- ↑ Mitt Romney at 4%; John Bolton at 2%; Cotton and Kasich at 1%; Owens, Rick Scott and Noem at 0%
- ↑ Christie at 2%
- ↑ Christie at 1%
- ↑ Noem and Christie at 1%; Cotton, Hawley and Rick Scott at 0%
- ↑ Mitt Romney at 2%; Christie at 1%; Cotton, Noem and Rick Scott at 0%
- ↑ Chris Christie at 2%; Rick Scott at 1%; Hawley, Stefanik, Cotton, Sasse and Noem at 0%
- ↑ Chris Christie at 1%
- ↑ Romney at 2%; Kristi Noem at 1%; Christie, Cotton, Hawley and Rick Scott at 0%
- ↑ Romney, Noem and Christie at 1%; Cotton, Hawley and Rick Scott at 0%
- ↑ Mitt Romney at 2%; Cotton, Christie at 1%; Hawley and Rick Scott at 0%
- ↑ Mitt Romney at 2%; Cotton, Christie at 1%; Hawley and Rick Scott at 0%
- ↑ Mitt Romney at 4%; Candace Owens at 3%; Cotton, Kasich at 1%; Bolton at 0%
- ↑ Josh Hawley at 2%; Christie, Stefanik at 1%, Cotton, Sasse, Rick Scott, Noem at 0%
- ↑ Calculated by taking the difference of 100% and all other candidates combined.
- ↑ Marco Rubio at 3%; Mike Pompeo at 2%; Tim Scott at 1%; and "Someone else" at 7%
- ↑ "Someone else" at 4%; Greg Abbott at 2%
- ↑ Glenn Youngkin at 1%, Tucker Carlson at 3%
- ↑ Tucker Carlson, Josh Hawley, Tom Cotton, and Kristi Noem at 1%
- 1 2 3 4 5 6 7 8 9 10 11 12 13 14 15 16 17 18 19 20 21 Standard VI response
- ↑ Candace Owens at 3%; Greg Abbott, Liz Cheney, Tom Cotton, John Kasich, Kristi Noem and Rick Scott at 1%
- ↑ Liz Cheney at 2%; Tom Cotton, Kristi Noem and Rick Scott at 1%
- ↑ Chris Christie at 7%; Kristi Noem at 3%, Josh Hawley at 1%
- ↑ Liz Cheney and John Kasich at 2%; Tom Cotton, Candace Owens and Rick Scott at 1%; Kristi Noem at 0%
- ↑ "Someone else" at 5%; Josh Hawley at 1%, Tom Cotton at 0%
- ↑ John Kasich, Kristi Noem and Candace Owens at 2%; Liz Cheney at 1%; Tom Cotton and Rick Scott at 0%
- ↑ Tucker Carlson at 2%, Kristi Noem at 1%; Tom Cotton at 0%
- ↑ Tom Cotton, Larry Hogan, and Kristi Noem at 1%; Chris Christie and Rick Scott at 0%
- ↑ Candace Owens at 4%; Liz Cheney, Tom Cotton, John Kasich and Rick Scott at 1%; Kristi Noem at 0%
- ↑ "Trump should not run again in 2024" as opposed to "Trump should run again in 2024" at 19%
- ↑ 22% of a full sample of 1,316 adults
- ↑ "Do not want Trump to run" as opposed to "want Trump to run" at 30%
- ↑ Candace Owens at 3%; John Kasich, Liz Cheney, Tucker Carlson, Rick Scott, and Kristi Noem at 1%; Tom Cotton at 0%
- ↑ Would not vote at 4%; "Someone else" at 2%; Liz Cheney and Kristi Noem at 1%; Rick Scott at 0%
- ↑ "Trump should not run again in 2024" as opposed to "Trump should run again in 2024" at 22%
- ↑ Republican subsample of total sample of 1574 likely voters
- ↑ "Unlikely or very unlikely to vote for Trump" as opposed to "Absolute will or likely to vote for Trump" at 24%; Would not vote at 3%
- ↑ "Consider voting for Trump" at 8%; Undecided at 4%
- ↑ John Kasich at 3%; Candace Owens at 2%; Tom Cotton, Rick Scott at 1%; Kristi Noem at 0%
- ↑ Kristi Noem at 1%
- ↑ Tom Cotton, Josh Hawley, Larry Hogan, and Kristi Noem at 1%; Chris Christie and Rick Scott at 0%
- ↑ On whether voters thought they'd support a Trump primary campaign if he ran
- ↑ "Would definitely not vote for Trump" at 16%
- ↑ Candace Owens at 3%; Tom Cotton and John Kasich at 2%; Kristi Noem, Tucker Carlson, and Tim Scott at 1%; Rick Scott at 0%
- ↑ "Someone else" at 12%; Josh Hawley at 2%, Tom Cotton at 1%
- ↑ Would not vote at 5%; "Someone else" at 3%; Tom Cotton, Josh Hawley, Larry Hogan, and Kristi Noem at 1%; Rick Scott at 0%
- ↑ GOP and GOP-leaning subsample of a full sample of 1,006 registered voters
- ↑ Among all adults (no Republican crosstab published). The same pollster showed 25% for Trump and 19% for Romney in November, when taking into account all voters and not only Republicans.[1]
- ↑ Larry Hogan at 6%, Ben Sasse at 3%; Rick Scott at 2%; Josh Hawley, Ivanka Trump at 1%
- ↑ Listed as "Skipped"
- ↑ Would not vote at 6%; "Someone else" at 5%; Kristi Noem at 2%; Tom Cotton, Josh Hawley, and Rick Scott at 1%
- ↑ Tucker Carlson at 3%, John Kasich and Kristi Noem at 2%; Tom Cotton at 1%; Rick Scott at 0%
- ↑ "Would not like to see Trump run for president in 2024" at 21%
- ↑ John Kasich at 3%; Tom Cotton, Kristi Noem, Tucker Carlson, and Rick Scott at 1%
- ↑ Would not vote at 5%; "Someone else" at 3%; Kristi Noem, Josh Hawley, and Rick Scott at 1%; Charlie Baker at 0%
- ↑ 37% of the full sample of 1,500 2020 general election voters
- ↑ Ivanka Trump and Tucker Carlson at 2%; Tom Cotton, Josh Hawley and Ben Sasse at 1%
- ↑ Among 304 republican adults as opposed to all adults
- ↑ Tucker Carlson at 4%, John Kasich and Rick Scott at 2%; Rick Santorum at 1%
- ↑ Republican subsample of 1,200 registered voters
- ↑ Respondents who think Trump should do something other than running for president in 2024 at 43%
- ↑ Christie and Someone Else at 3%; Burgum, Hutchinson and Stapleton at 1%; Binkley at 0%
- ↑ "Someone else" at 3%; Christie at 2%; Binkley, Burgum, Hutchinson and Johnson at 1%; Elder, Hurd, Stapleton and Suarez at 0%
- ↑ Christie at 4%; Elder at 2%; Binkley, Burgum, Hutchinson, Johnson, Stapleton and Suarez at 1%; Hurd at 0%; Someone Else at 4%
- ↑ Liz Cheney at 3%; Greg Abbott at 2%; Chris Christie, Tom Cotton, Dan Crenshaw, Brian Kemp, Kristi Noem, and Glenn Youngkin at 1%.
- ↑ Greg Abbott, Liz Cheney, and Candance Owens at 2%; John Bolton, Tom Cotton, John Kasich, Kristi Noem, and Rick Scott at 1%.
- ↑ "Someone Else" at 3%; Chris Christie at 2%; Greg Abbott, Liz Cheney, and Glenn Youngkin at 1%.
- ↑ Greg Abbott at 3%; Liz Cheney, John Kasich, Kristi Noem, and Candance Owens at 2%; John Bolton, Tom Cotton, Richard Grenell, and Rick Scott at 1%.
- ↑ Liz Cheney at 3%; Greg Abbott, Kristi Noem, Rick Scott, and Glenn Youngkin at 1%.
- ↑ Chris Christie at 2%; Liz Cheney, Kristi Noem, and Glenn Youngkin at 1%.
- ↑ Candance Owens at 4%; Greg Abbott at 2%; Liz Cheney, Tom Cotton, John Kasich, Kristi Noem, and Rick Scott at 1%.
- ↑ Liz Cheney at 2%; Greg Abbott, Chris Christie, Tom Cotton, and Glenn Youngkin at 1%.
- ↑ "Someone Else," at 6%; Glenn Youngkin at 4%; Greg Abbott at 3%.
- ↑ "Someone Else," at 2%; Greg Abbott, Liz Cheney, Chris Christie, Kristi Noem, Rick Scott, and Marjorie Taylor Greene at 1%.
- ↑ Greg Abbott and Candance Owens at 3%; John Bolton, Tom Cotton, Liz Cheney, Richard Grenell, John Kasich, and Rick Scott at 1%.
- ↑ "Someone Else," Greg Abbott, Liz Cheney, and Tom Cotton at 1%.
- ↑ Candance Owens at 3%; Greg Abbott at 2%; Tom Cotton and Kristi Noem at 1%.
- ↑ Liz Cheney, Kristi Noem, and Rick Scott at 1%.
- ↑ Liz Cheney and Tom Cotton at 2%; Greg Abbott, Chris Christie, Kristi Noem, Ben Sasse, Rick Scott, and Glenn Youngkin at 1%.
- ↑ Candance Owens at 4%; Greg Abbott, Tom Cotton, John Kasich, and Kristi Noem at 2%; Liz Cheney and Rick Scott at 1%.
- ↑ "Someone Else" at 14%; Liz Cheney, Chris Christie, and Kristi Noem at 1%.
- ↑ Liz Cheney at 2%; Greg Abbott, Chris Christie, Tom Cotton, and Glenn Youngkin at 1%.
- ↑ Candance Owens at 3%; Greg Abbot, Liz Cheney, Tom Cotton, and Kristi Noem at 1%.
- ↑ Liz Cheney at 3%; Greg Abbott at 2%, Chris Christie and Kristi Noem at 1%.
- ↑ Liz Cheney, Greg Abbott, Chris Christie, Glenn Youngkin, Rick Scott, and "Someone else" at 1%; Larry Hogan, Tom Cotton, Ben Sasse, and Kristi Noem at 0%.
- ↑ Liz Cheney and Kristi Noem at 2%; "Someone else", Greg Abbott, Chris Christie and Tom Cotton at 1%; Josh Hawley, Larry Hogan, Ben Sasse and Rick Scott at 0%
- ↑ Candace Owens at 5%; Greg Abbott, Liz Cheney, John Kasich, Kristi Noem and Rick Scott at 2%; Tom Cotton at 1%
- ↑ "Someone else" at 3%; Liz Cheney, Chris Christie, Tom Cotton, Josh Hawley and Kristi Noem at 1%; Greg Abbott, Ben Sasse, Rick Scott and Marjorie Taylor Greene at 0%
- ↑ Candace Owens at 5%; Liz Cheney and John Kasich at 2%; Tom Cotton, Kristi Noem and Rick Scott at 1%
- ↑ "Someone else" at 8%; Tom Cotton at 1%
- ↑ Candace Owens at 6%; Ivanka Trump at 5%; Kristi Noem at 2%; Liz Cheney, Tom Cotton and John Kasich at 1%; Rick Scott at 0%
- ↑ "Someone else" at 1%; Greg Abbott, Liz Cheney, Tom Cotton, Josh Hawley and Kristi Noem at 1%; Chris Christie, Larry Hogan, Ben Sasse and Rick Scott at 0%
- ↑ Kristi Noem at 2%; Tom Cotton and Rick Scott at 1%; Chris Christie at 0%
- ↑ "Someone else" at 2%; Greg Abbott, Liz Cheney, Chris Christie, Kristi Noem and Rick Scott at 1%; Tom Cotton, Josh Hawley and Ben Sasse at 0%
- ↑ Ivanka Trump at 4%; Candace Owens at 3%; Liz Cheney at 2%; Tom Cotton, John Kasich, Kristi Noem and Rick Scott at 1%
- ↑ Candace Owens at 5%; Ivanka Trump at 3%; John Kasich at 2%; Liz Cheney, Tom Cotton, and Kristi Noem at 1%; Rick Scott at 0%
- ↑ Liz Cheney at 3%; Greg Abbott, Tom Cotton, Kristi Noem, Ben Sasse and "Someone else" at 1%; Chris Christie and Rick Scott at 0%; Dave Portnoy at no voters
- ↑ Republican subsample of total sample of 1574 likely voters
- ↑ "Someone else" at 19%; Kristi Noem and Ben Sasse at 1%
- ↑ Kristi Noem and "Someone else" at 1%; Greg Abbott, Dave Portnoy and Rick Scott at 0%; Tom Cotton and Ben Sasse at no voters
- ↑ Candace Owens at 4%; Ivanka Trump at 3%; Tom Cotton, John Kasich at 2%; Rick Scott and Kristi Noem at 1%
- ↑ Greg Abbott at 2%; "Someone else," Tom Cotton, Tim Scott, Kristi Noem, Ben Sasse, Rick Scott, Josh Hawley, and Dave Portnoy at 1% or less
- ↑ Kristi Noem at 4%; Chris Christie, Tom Cotton and Rick Scott at 1%
- ↑ Candace Owens at 4%; Ivanka Trump at 3%; Tom Cotton, John Kasich, Kristi Noem, and Tim Scott at 2%; Rick Scott at 1%
- ↑ "Other" at 21%; Tom Cotton and Kristi Noem at 4%; Greg Abbott and Devin Nunes at 2%
- ↑ "Someone else" at 16%; Tom Cotton at 3%
- ↑ Dan Crenshaw, Kristi Noem, Ben Sasse and "Someone else" at 2%; Tom Cotton, John Kasich, Rand Paul at 1%; Greg Abbott, Dave Portnoy, and Elise Stefanik at 1% or less
- ↑ GOP and GOP-leaning subsample of a full sample of 1,006 registered voters
- ↑ Rand Paul at 3%; John Kasich and "Someone else" at 2%; Dan Crenshaw and Tom Cotton at 1%; Greg Abbott, Larry Hogan, Ben Sasse and Elise Stefanik at 0%
- ↑ Among all adults (no Republican crosstab published). The same pollster showed 25% for Trump and 19% for Romney in November, when taking into account all voters and not only Republicans.[1]
- ↑ Ben Sasse and Ivanka Trump at 3%; Rick Scott at 2%
- ↑ Ivanka Trump at 4%; John Kasich at 3%; Tom Cotton, Kristi Noem at 2%; Rick Scott at 0%
- ↑ Among 304 republican adults as opposed to all adults
- ↑ Rick Santorum at 3%; John Kasich and Rick Scott at 2%
- ↑ John Kasich at 2%; Tom Cotton, Kristi Noem and Rick Scott at 1%
- ↑ "Someone else" at 3%; Tom Cotton, Dan Crenshaw, Lindsey Graham and John Kasich at 2%; Ben Sasse and Elise Stefanik at 0%
- ↑ Paul Ryan at 4%; Ivanka Trump at 3%; Kevin McCarthy at 2%
- Partisan clients
- ↑ Poll sponsored by Harvard University Center for American Political Studies
- ↑ Poll commissioned by the Republican Main Street Partnership
References
- 1 2 "Leger's Weekly Survey" (PDF). Archived (PDF) from the original on February 9, 2021. Retrieved November 18, 2020.