| ||||||||||||||||||||||||||||
All 8 Minnesota seats to the United States House of Representatives | ||||||||||||||||||||||||||||
|---|---|---|---|---|---|---|---|---|---|---|---|---|---|---|---|---|---|---|---|---|---|---|---|---|---|---|---|---|
| ||||||||||||||||||||||||||||
| Elections in Minnesota |
|---|
 |
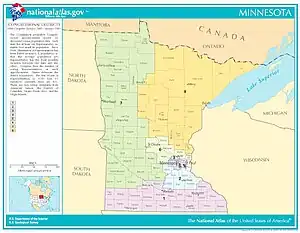
The 2004 congressional elections in Minnesota were held on November 2, 2004 to determine who would represent the state of Minnesota in the United States House of Representatives.
Minnesota had eight seats in the House, apportioned according to the 2000 United States census. Representatives are elected for two-year terms; those elected served in the 109th Congress from January 3, 2005 until January 3, 2007. The election coincided with the 2004 presidential election. All of the incumbents who represented Minnesota in the United States House of Representative in the 108th Congress were re-elected to the 109th Congress.
Overview
| United States House of Representatives elections in Minnesota, 2004 [1] | |||||
|---|---|---|---|---|---|
| Party | Votes | Percentage | Seats | +/– | |
| Democratic-Farmer-Labor | 1,399,624 | 51.42% | 4 | — | |
| Republican | 1,236,094 | 45.42% | 4 | — | |
| Independence | 56,490 | 2.08% | 0 | — | |
| Green | 26,917 | 0.99% | 0 | — | |
| Others | 2,556 | 0.09% | 0 | — | |
| Totals | 2,721,681 | 100.00% | 8 | — | |
District 1
| |||||||||||||||||
 Precinct results Gutknecht: 40–50% 50–60% 60–70% 70–80% 80–90% >90% Pomeroy: 40–50% 50–60% 60–70% 70–80% >90% Tie: 40–50% 50% No votes | |||||||||||||||||
| |||||||||||||||||


Incumbent Republican Gil Gutknecht, who had represented Minnesota's 1st congressional district since 1994, ran against Leigh Pomeroy of the DFL and Gregory Mikkelson of the Independence Party. Gutknecht easily won a fifth term, defeating second-place Pomeroy by a comfortable 24 percent margin, as Mikkelson placed at an even more distant third.
DFL primary
Candidates
- Leigh Pomeroy, university professor
Results
| Party | Candidate | Votes | % | |
|---|---|---|---|---|
| Democratic (DFL) | Leigh Pomeroy | 12,682 | 100.00 | |
| Total votes | 12,682 | 100.00 | ||
Independence primary
Candidates
- Gregory Mikkelson
- David Pechulis
Results
| Party | Candidate | Votes | % | |
|---|---|---|---|---|
| Independence | Gregory Mikkelson | 765 | 67.11 | |
| Independence | David Pechulis | 375 | 32.89 | |
| Total votes | 1,140 | 100.00 | ||
Republican primary
Candidates
- Gil Gutknecht, incumbent U.S. Representative since 1994
Results
| Party | Candidate | Votes | % | |
|---|---|---|---|---|
| Republican | Gil Gutknecht (Incumbent) | 17,651 | 100.00 | |
| Total votes | 17,651 | 100.00 | ||
General election
Results
| Party | Candidate | Votes | % | |
|---|---|---|---|---|
| Republican | Gil Gutknecht (Incumbent) | 193,132 | 59.60 | |
| Democratic (DFL) | Leigh Pomeroy | 115,088 | 35.52 | |
| Independence | Gregory Mikkelson | 15,569 | 4.80 | |
| Write-in | 266 | 0.08 | ||
| Total votes | 324,055 | 100.00 | ||
| Republican hold | ||||
District 2
| |||||||||||||||||
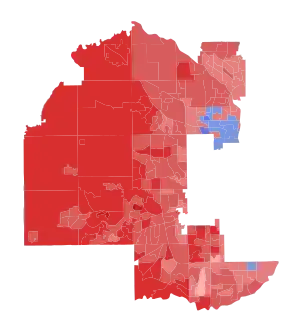
 Precinct results Kline: 40–50% 50–60% 60–70% 70–80% Daly: 40–50% 50–60% 60–70% 70–80% >90% No votes | |||||||||||||||||
| |||||||||||||||||
.jpg.webp)
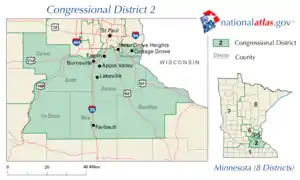
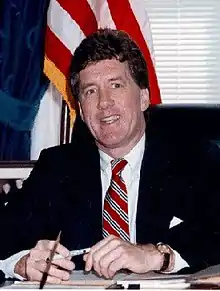
Incumbent Republican John Kline, who was first elected in 2002, ran against Teresa Daly of the DFL and Doug Williams of the Independence Party. Kline won a second term, defeating Daly by a 16 percent margin, as Williams finished a very distant third.
DFL primary
Candidates
- Teresa Daly, Burnsville City Councilor
Results
| Party | Candidate | Votes | % | |
|---|---|---|---|---|
| Democratic (DFL) | Teresa Daly | 10,206 | 100.00 | |
| Total votes | 10,206 | 100.00 | ||
Independence primary
Candidates
- Doug Williams
Results
| Party | Candidate | Votes | % | |
|---|---|---|---|---|
| Independence | Doug Williams | 493 | 100.00 | |
| Total votes | 493 | 100.00 | ||
Republican primary
Candidates
- John Kline, incumbent U.S. Representative since 2003
Results
| Party | Candidate | Votes | % | |
|---|---|---|---|---|
| Republican | John Kline (Incumbent) | 12,710 | 100.00 | |
| Total votes | 12,710 | 100.00 | ||
General election
Results
| Party | Candidate | Votes | % | |
|---|---|---|---|---|
| Republican | John Kline (Incumbent) | 206,313 | 56.38 | |
| Democratic (DFL) | Teresa Daly | 147,527 | 40.38 | |
| Independence | Doug Williams | 11,822 | 3.23 | |
| Write-in | 283 | 0.08 | ||
| Total votes | 365,945 | 100.00 | ||
| Republican hold | ||||
District 3
| |||||||||||||||||
 Precinct results Ramstad: 40–50% 50–60% 60–70% 70–80% 80–90% Watts: 50–60% 60–70% No votes | |||||||||||||||||
| |||||||||||||||||
Incumbent Republican Jim Ramstad, who was first elected in 1990, faced a primary challenge from Burton Hanson, but won renomination by a margin of nearly 80 percent in the Republican primary. In the general election, Ramstad defeated DFL challenger Deborah Watts, easily winning election to his eighth term in Congress.
DFL primary
Candidates
- Deborah Watts
Results
| Party | Candidate | Votes | % | |
|---|---|---|---|---|
| Democratic (DFL) | Deborah Watts | 7,438 | 100.00 | |
| Total votes | 7,438 | 100.00 | ||
Republican primary
Candidates
- Burton Hanson
- Jim Ramstad, incumbent U.S. Representative since 1991
Results
| Party | Candidate | Votes | % | |
|---|---|---|---|---|
| Republican | Jim Ramstad (Incumbent) | 19,232 | 89.91 | |
| Republican | Burton Hanson | 2,159 | 10.09 | |
| Total votes | 21,391 | 100.00 | ||
General election
Results
| Party | Candidate | Votes | % | |
|---|---|---|---|---|
| Republican | Jim Ramstad (Incumbent) | 231,871 | 64.61 | |
| Democratic (DFL) | Deborah Watts | 126,665 | 35.29 | |
| Write-in | 356 | 0.10 | ||
| Total votes | 358,892 | 100.00 | ||
| Republican hold | ||||
District 4
| |||||||||||||||||||||
 Precinct results McCollum: 40–50% 50–60% 60–70% 70–80% 80–90% Bataglia: 40–50% 50–60% 60–70% No votes | |||||||||||||||||||||
| |||||||||||||||||||||
.jpg.webp)
Incumbent DFLer Betty McCollum, who was first elected in 2000, faced off against Patrice Bataglia of the Republican Party of Minnesota and Peter F. Vento of the Independence Party of Minnesota. Defeating Bataglia by a comfortable 24 percent margin, McCollum easily won re-election to her third term in Congress, as Vento finished a distant third
DFL primary
Candidates
- Betty McCollum, incumbent U.S. Representative since 2001
Results
| Party | Candidate | Votes | % | |
|---|---|---|---|---|
| Democratic (DFL) | Betty McCollum (Incumbent) | 16,529 | 100.00 | |
| Total votes | 16,529 | 100.00 | ||
Independence primary
Candidates
- Bob Cardinal
- Peter F. Vento
Results
| Party | Candidate | Votes | % | |
|---|---|---|---|---|
| Independence | Peter F. Vento | 754 | 60.86 | |
| Independence | Bob Cardinal | 485 | 39.14 | |
| Total votes | 1,239 | 100.00 | ||
Republican primary
Candidates
- Patrice Bataglia, Dakota County commissioner
- Jack Shepard, fugitive, alleged arsonist, and former Minneapolis dentist who fled the country after allegedly attempting to burn down his own dental office[3]
Results
| Party | Candidate | Votes | % | |
|---|---|---|---|---|
| Republican | Patrice Bataglia | 7,969 | 76.73 | |
| Republican | Jack Shepard | 2,417 | 23.27 | |
| Total votes | 10,386 | 100.00 | ||
General election
Results
| Party | Candidate | Votes | % | |
|---|---|---|---|---|
| Democratic (DFL) | Betty McCollum (Incumbent) | 182,387 | 57.48 | |
| Republican | Patrice Bataglia | 105,467 | 33.24 | |
| Independence | Peter F. Vento | 29,099 | 9.17 | |
| Write-in | 346 | 0.11 | ||
| Total votes | 317,299 | 100.00 | ||
| Democratic (DFL) hold | ||||
District 5
| |||||||||||||||||||||
 Precinct results Sabo: 40–50% 50–60% 60–70% 70–80% 80–90% >90% No votes | |||||||||||||||||||||
| |||||||||||||||||||||

.jpg.webp)
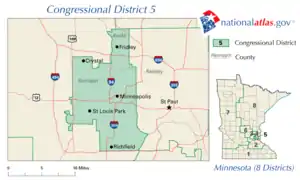
Incumbent DFLer Martin Sabo, who was first elected in 1978, was challenged for the nomination by Dick Franson, but Sabo won the primary election by a landslide 82 percent margin. In the general election, Sabo had no difficulty winning his 14th term in Congress, defeating Republican challenger Daniel Mathias by a margin of more than 45 percent, while Green candidate Jay Pond finished a distant third.
DFL primary
Candidates
- "Dick" Franson, perennial candidate[4]
- Martin Olav Sabo, incumbent U.S. Representative
Results
| Party | Candidate | Votes | % | |
|---|---|---|---|---|
| Democratic (DFL) | Martin Olav Sabo (Incumbent) | 23,047 | 91.06 | |
| Democratic (DFL) | "Dick" Franson | 2,264 | 8.94 | |
| Total votes | 25,311 | 100.00 | ||
Green primary
Candidates
- Jay Pond
Results
| Party | Candidate | Votes | % | |
|---|---|---|---|---|
| Green | Jay Pond | 665 | 100.00 | |
| Total votes | 665 | 100.00 | ||
Republican primary
Candidates
- Daniel Mathias
Results
| Party | Candidate | Votes | % | |
|---|---|---|---|---|
| Republican | Daniel Mathias | 5,840 | 100.00 | |
| Total votes | 5,840 | 100.00 | ||
General election
Results
| Party | Candidate | Votes | % | |
|---|---|---|---|---|
| Democratic (DFL) | Martin Olav Sabo (Incumbent) | 218,434 | 69.67 | |
| Republican | Daniel Mathias | 76,600 | 24.43 | |
| Green | Jay Pond | 17,984 | 5.74 | |
| Write-in | 508 | 0.16 | ||
| Total votes | 313,526 | 100.00 | ||
| Democratic (DFL) hold | ||||
District 6
| |||||||||||||||||
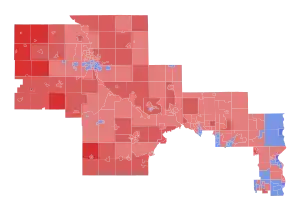 Precinct results Kennedy: 50–60% 60–70% 70–80% Wetterling: 40–50% 50–60% 60–70% No votes | |||||||||||||||||
| |||||||||||||||||
.jpg.webp)

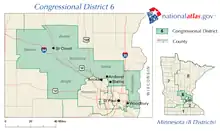
Incumbent Republican Mark Kennedy, who was first elected in 2000, encountered little difficulty winning his third term in Congress, although the election in Minnesota's 6th congressional district was by far the closest congressional election in Minnesota in 2004. Kennedy defeated his DFL challenger, child safety advocate Patty Wetterling, by a margin of about 8 percent.
DFL primary
Candidates
- Patty Wetterling, child safety advocate, and mother of kidnapping and murder victim Jacob Wetterling
Results
| Party | Candidate | Votes | % | |
|---|---|---|---|---|
| Democratic (DFL) | Patty Wetterling | 10,385 | 100.00 | |
| Total votes | 10,385 | 100.00 | ||
Republican primary
Candidates
- Mark Kennedy, incumbent U.S. Representative since 2001
Results
| Party | Candidate | Votes | % | |
|---|---|---|---|---|
| Republican | Mark Kennedy (Incumbent) | 11,817 | 100.00 | |
| Total votes | 11,817 | 100.00 | ||
General election
Results
| Party | Candidate | Votes | % | |
|---|---|---|---|---|
| Republican | Mark Kennedy (Incumbent) | 203,669 | 53.99 | |
| Democratic (DFL) | Patty Wetterling | 173,309 | 45.94 | |
| Write-in | 246 | 0.07 | ||
| Total votes | 377,224 | 100.00 | ||
| Republican hold | ||||
District 7
| |||||||||||||||||
 Precinct results Peterson: 40–50% 50–60% 60–70% 70–80% 80–90% >90% Sturrock: 50–60% 60–70% 70–80% Tie: 50% | |||||||||||||||||
| |||||||||||||||||
.jpg.webp)
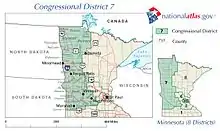
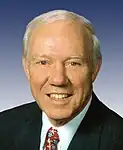
Incumbent DFLer Collin Peterson, who was first elected in 1990, faced no difficulty winning his eighth term in Congress, defeating Republican challenger David Sturrock by a landslide 32 percent margin.
DFL primary
Candidates
- Collin C. Peterson, incumbent U.S. Representative since 1991
Results
| Party | Candidate | Votes | % | |
|---|---|---|---|---|
| Democratic (DFL) | Collin C. Peterson (Incumbent) | 16,036 | 100.00 | |
| Total votes | 16,036 | 100.00 | ||
Republican primary
Candidates
- David E. Sturrock
Results
| Party | Candidate | Votes | % | |
|---|---|---|---|---|
| Republican | David E. Sturrock | 10,882 | 100.00 | |
| Total votes | 10,882 | 100.00 | ||
General election
Results
| Party | Candidate | Votes | % | |
|---|---|---|---|---|
| Democratic (DFL) | Collin C. Peterson (Incumbent) | 207,628 | 66.07 | |
| Republican | David E. Sturrock | 106,349 | 33.84 | |
| Write-in | 280 | 0.09 | ||
| Total votes | 314,257 | 100.00 | ||
| Democratic (DFL) hold | ||||
District 8
| |||||||||||||||||
 Precinct results Oberstar: 30–40% 40–50% 50–60% 60–70% 70–80% 80–90% >90% Groettum: 30–40% 40–50% 50–60% 60–70% 70–80% Write-Ins: 30–40% Tie: 40–50% 50% No votes | |||||||||||||||||
| |||||||||||||||||
Incumbent DFLer Jim Oberstar, who was first elected in 1974, was challenged for the nomination by Michael H. Johnson, but Oberstar won the primary election by a landslide 71 percent margin. In the general election, Oberstar had no difficulty winning his 16th term in Congress, defeating Republican challenger Mark Groettum by a margin of more than 33 percent, while Green candidate Van Presley finished a very distant third.
DFL primary
Candidates
- Michael H. Johnson
- James L. Oberstar, incumbent U.S. Representative since 1975
Results
| Party | Candidate | Votes | % | |
|---|---|---|---|---|
| Democratic (DFL) | James L. Oberstar (Incumbent) | 37,353 | 85.54 | |
| Democratic (DFL) | Michael H. Johnson | 6,314 | 14.46 | |
| Total votes | 43,667 | 100.00 | ||
Green primary
Candidates
- Van Presley
Results
| Party | Candidate | Votes | % | |
|---|---|---|---|---|
| Green | Van Presley | 516 | 100.00 | |
| Total votes | 516 | 100.00 | ||
Republican primary
Candidates
- Mark Groettum
Results
| Party | Candidate | Votes | % | |
|---|---|---|---|---|
| Republican | Daniel Mathias | 13,429 | 100.00 | |
| Total votes | 13,429 | 100.00 | ||
General election
Results
| Party | Candidate | Votes | % | |
|---|---|---|---|---|
| Democratic (DFL) | James L. Oberstar (Incumbent) | 228,586 | 65.22 | |
| Republican | Mark Groettum | 112,693 | 32.15 | |
| Green | Van Presley | 8,933 | 2.55 | |
| Write-in | 271 | 0.08 | ||
| Total votes | 350,483 | 100.00 | ||
| Democratic (DFL) hold | ||||
References
- 1 2 3 4 5 6 7 8 9 "Home - Election Results".
- 1 2 3 4 5 6 7 8 9 10 11 12 13 14 15 16 17 18 19 20 21 "Home - Election Results".
- ↑ "Support Jack Shepard, the Arsonist, for Congress". HuffPost. May 20, 2010.
- ↑ Russell, Scott (July 26, 2004). "Downtown candidates file for election". The Journal. Retrieved July 13, 2021.