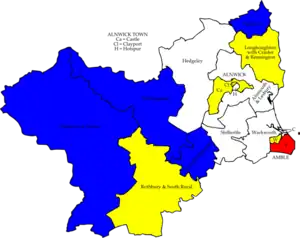
Alnwick District Council elections were generally held every four years between the council's creation in 1974 and its abolition in 2009. Alnwick District was a non-metropolitan district in Northumberland, England. The council was abolished and its functions transferred to Northumberland County Council with effect from 1 April 2009.
Political control
The first election to the council was held in 1973, initially operating as a shadow authority before coming into its powers on 1 April 1974. From 1973 until its abolition in 2009 political control of the council was held by the following parties:[1][2]
| Party in control | Years | |
|---|---|---|
| Independent | 1973–1979 | |
| No overall control | 1979–1991 | |
| Liberal Democrats | 1991–1995 | |
| No overall control | 1995–2009 | |
Council elections
- 1973 Alnwick District Council election
- 1976 Alnwick District Council election
- 1979 Alnwick District Council election (New ward boundaries)[3]
- 1983 Alnwick District Council election
- 1987 Alnwick District Council election
- 1991 Alnwick District Council election
- 1995 Alnwick District Council election
- 1999 Alnwick District Council election (New ward boundaries increased the number of seats by one)[4][5]
- 2003 Alnwick District Council election
- 2007 Alnwick District Council election
District result maps
 2007 results map
By-election results
1995-1999
| Party | Candidate | Votes | % | ±% | |
|---|---|---|---|---|---|
| Liberal Democrats | 365 | 37.1 | |||
| Conservative | 324 | 32.9 | |||
| Labour | 296 | 30.0 | |||
| Majority | 41 | 4.2 | |||
| Turnout | 985 | 40.0 | |||
| Liberal Democrats gain from Labour | Swing | ||||
| Party | Candidate | Votes | % | ±% | |
|---|---|---|---|---|---|
| Liberal Democrats | 775 | 81.9 | +35.3 | ||
| Conservative | 171 | 18.1 | +18.1 | ||
| Majority | 604 | 63.8 | |||
| Turnout | 946 | ||||
| Liberal Democrats hold | Swing | ||||
1999-2003
| Party | Candidate | Votes | % | ±% | |
|---|---|---|---|---|---|
| Liberal Democrats | 220 | 58.5 | -11.4 | ||
| Independent | 154 | 41.2 | +41.2 | ||
| Majority | 66 | 17.3 | |||
| Turnout | 374 | 47.5 | |||
| Liberal Democrats hold | Swing | ||||
2003-2007
| Party | Candidate | Votes | % | ±% | |
|---|---|---|---|---|---|
| Liberal Democrats | Ethel Mills | 193 | 35.3 | +3.1 | |
| Independent | John Taylor | 167 | 30.5 | -14.0 | |
| Labour | Mary Dixon | 158 | 28.9 | +5.6 | |
| Independent | Eric Thomason | 29 | 5.3 | +5.3 | |
| Majority | 26 | 4.8 | |||
| Turnout | 547 | 19.7 | |||
| Liberal Democrats hold | Swing | ||||
| Party | Candidate | Votes | % | ±% | |
|---|---|---|---|---|---|
| Liberal Democrats | Robert Styring | 300 | 39.0 | +16.1 | |
| Independent | Judith Hill | 225 | 29.3 | -20.3 | |
| Conservative | Peter McIlroy | 168 | 21.8 | -5.7 | |
| Independent | Leslie Orange | 76 | 9.9 | +9.9 | |
| Majority | 75 | 9.7 | |||
| Turnout | 566 | 51.3 | |||
| Liberal Democrats gain from Conservative | Swing | ||||
| Party | Candidate | Votes | % | ±% | |
|---|---|---|---|---|---|
| Liberal Democrats | Ian Hinson | 237 | 56.3 | +21.6 | |
| Independent | Stanley Ireland | 94 | 22.3 | -19.7 | |
| Conservative | David Rixon | 90 | 21.4 | +21.4 | |
| Majority | 143 | 34.0 | |||
| Turnout | 421 | 26.0 | |||
| Liberal Democrats gain from Independent | Swing | ||||
References
- ↑ "Compositions calculator". The Elections Centre. Retrieved 10 August 2022.
- ↑ "Alnwick". BBC News Online. Retrieved 15 May 2011.
- ↑ The District of Alnwick (Electoral Arrangements) Order 1976
- ↑ "Alnwick". BBC Online. Retrieved 30 July 2008.
- ↑ legislation.gov.uk - The District of Alnwick (Electoral Changes) Order 1998. Retrieved on 4 October 2015.
- ↑ "Shilbottle Ward By Election 14th July 2005". Alnwick District Council. Archived from the original on 7 November 2007. Retrieved 15 May 2011.
- ↑ "Lib Dems and Labour make byelection gains". guardian.co.uk. 7 April 2006. Retrieved 15 May 2011.
- By-election results Archived 29 March 2010 at the Wayback Machine
This article is issued from Wikipedia. The text is licensed under Creative Commons - Attribution - Sharealike. Additional terms may apply for the media files.