El Palmar, Quetzaltenango | |
|---|---|
Municipality and town | |
 | |
| Country | |
| Department | |
| Area | |
| • Municipality and town | 66 sq mi (171 km2) |
| Population (2018 census)[1] | |
| • Municipality and town | 29,132 |
| • Density | 440/sq mi (170/km2) |
| • Urban | 19,115 |
| Time zone | UTC+6 (Central Time) |
| Climate | Am |
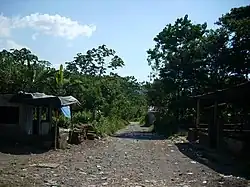
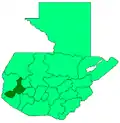
El Palmar is a municipality in the Quetzaltenango department of Guatemala which has a population of 32,065.[2]
El Palmar is mostly an agricultural municipality, with coffee being one of its main products.
Many years ago, El Palmar was nearly destroyed by a volcanic eruption of the Santiaguito volcano. Nuevo El Palmar was founded a few kilometers away where most people re-settled. Some inhabitants chose to stay or go back to the original town.

The original town was nearly destroyed again by another volcanic eruption in the late 1990s. The inhabitants were given the alternative to re-settle in El Nuevo Palmar by the Guatemalan government. Those who chose to stay would do so at their own risk. Those who re-settled in El Nuevo Palmar did so into the suburbs of this town. A few months later, the entire town was destroyed by another flood of mud from a volcanic eruption. The old town is still declared a risk zone and anyone who enters does so under their own risk.
In October 2005 a bridge was destroyed here by Hurricane Stan, cutting off a large portion of the southwest region from the rest of the country. It has since been restored.
Climate
El Palmar has a tropical monsoon climate (Am) with moderate to little rainfall from December to March and heavy to very heavy rainfall year round from April to November and extremely heavy rainfall in September.
| Climate data for El Palmar | |||||||||||||
|---|---|---|---|---|---|---|---|---|---|---|---|---|---|
| Month | Jan | Feb | Mar | Apr | May | Jun | Jul | Aug | Sep | Oct | Nov | Dec | Year |
| Mean daily maximum °C (°F) | 28.2 (82.8) |
28.7 (83.7) |
29.4 (84.9) |
29.4 (84.9) |
29.1 (84.4) |
27.9 (82.2) |
28.5 (83.3) |
28.8 (83.8) |
27.8 (82.0) |
27.4 (81.3) |
27.9 (82.2) |
28.1 (82.6) |
28.4 (83.2) |
| Daily mean °C (°F) | 21.9 (71.4) |
22.4 (72.3) |
23.2 (73.8) |
23.7 (74.7) |
23.8 (74.8) |
23.1 (73.6) |
23.3 (73.9) |
23.5 (74.3) |
22.9 (73.2) |
22.6 (72.7) |
22.5 (72.5) |
22.1 (71.8) |
22.9 (73.3) |
| Mean daily minimum °C (°F) | 15.7 (60.3) |
16.2 (61.2) |
17.1 (62.8) |
18.0 (64.4) |
18.5 (65.3) |
18.3 (64.9) |
18.1 (64.6) |
18.2 (64.8) |
18.1 (64.6) |
17.8 (64.0) |
17.2 (63.0) |
16.2 (61.2) |
17.5 (63.4) |
| Average precipitation mm (inches) | 29 (1.1) |
29 (1.1) |
75 (3.0) |
182 (7.2) |
452 (17.8) |
666 (26.2) |
502 (19.8) |
565 (22.2) |
709 (27.9) |
633 (24.9) |
208 (8.2) |
57 (2.2) |
4,107 (161.6) |
| Source: Climate-Data.org[3] | |||||||||||||
References
- ↑ Citypopulation.de Population of departments and municipalities in Guatemala
- ↑ "El Palmar (Municipality, Guatemala) - Population Statistics, Charts, Map and Location". citypopulation.de. Retrieved 2023-11-05.
- ↑ "Climate: El Palmar". Climate-Data.org. Retrieved July 26, 2020.
