La Villa, Texas | |
|---|---|
| City of La Villa | |
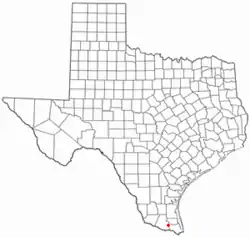
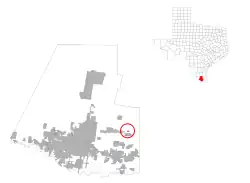
 Location of La Villa, Texas | |
 | |
| Coordinates: 26°17′53″N 97°55′37″W / 26.29806°N 97.92694°W | |
| Country | |
| State | |
| County | |
| Government | |
| • Type | The City of La Villa is a Type A General Law operating under the Council-Manager form of government. |
| Area | |
| • Total | 0.60 sq mi (1.54 km2) |
| • Land | 0.60 sq mi (1.54 km2) |
| • Water | 0.00 sq mi (0.00 km2) |
| Elevation | 52 ft (16 m) |
| Population | |
| • Total | 1,957 |
| • Estimate (2019)[3] | 2,870 |
| • Density | 4,815.44/sq mi (1,857.97/km2) |
| Time zone | UTC-6 (Central (CST)) |
| • Summer (DST) | UTC-5 (CDT) |
| ZIP code | 78562 |
| Area code | 956 |
| FIPS code | 48-41788[4] |
| GNIS feature ID | 1339419[5] |
| Website | http://www.cityoflavilla.org |
La Villa is a city in Hidalgo County, Texas. The population was 1,957 at the 2010 United States Census. It is part of the McAllen–Edinburg–Mission and Reynosa–McAllen metropolitan areas.
Geography
La Villa is located at 26°17′53″N 97°55′37″W / 26.29806°N 97.92694°W (26.298093, –97.926927).[2]
According to the United States Census Bureau, the city has a total area of 0.3 square miles (0.78 km2), all land.
Demographics
| Census | Pop. | Note | %± |
|---|---|---|---|
| 1960 | 1,261 | — | |
| 1970 | 1,255 | −0.5% | |
| 1980 | 1,442 | 14.9% | |
| 1990 | 1,388 | −3.7% | |
| 2000 | 1,305 | −6.0% | |
| 2010 | 1,957 | 50.0% | |
| 2019 (est.) | 2,870 | [3] | 46.7% |
| U.S. Decennial Census[6] | |||
2020 census
| Race | Number | Percentage |
|---|---|---|
| White (NH) | 702 | 25.04% |
| Black or African American (NH) | 4 | 0.14% |
| Asian (NH) | 3 | 0.11% |
| Some Other Race (NH) | 2 | 0.07% |
| Mixed/Multi-Racial (NH) | 4 | 0.14% |
| Hispanic or Latino | 2,089 | 74.5% |
| Total | 2,804 |
As of the 2020 United States census, there were 2,804 people, 386 households, and 305 families residing in the city.
2000 census
At the 2000 census there were 1,305 people in 323 households, including 290 families, in the city. The population density was 4,870.4 inhabitants per square mile (1,880.5/km2). There were 354 housing units at an average density of 1,321.2 per square mile (510.1/km2). The racial makeup of the city was 66.67% White, 0.08% African American, 0.38% Native American, 0.08% Pacific Islander, 30.34% from other races, and 2.45% from two or more races. Hispanic or Latino of any race were 98.08%.[4]
Of the 323 households 49.8% had children under the age of 18 living with them, 62.2% were married couples living together, 25.4% had a female householder with no husband present, and 10.2% were non-families. 9.9% of households were one person and 5.6% were one person aged 65 or older. The average household size was 4.04 and the average family size was 4.35.
The age distribution was 37.1% under the age of 18, 12.6% from 18 to 24, 25.6% from 25 to 44, 16.5% from 45 to 64, and 8.2% 65 or older. The median age was 25 years. For every 100 females, there were 87.5 males. For every 100 females age 18 and over, there were 84.1 males.
The median household income was $18,333 and the median family income was $20,284. Males had a median income of $14,769 versus $15,682 for females. The per capita income for the city was $5,432. About 48.4% of families and 47.6% of the population were below the poverty line, including 59.5% of those under age 18 and 35.9% of those age 65 or over.
Education
La Villa is served by the La Villa Independent School District.
In January 2014 the school district had 625 students. During that month, shortly after the end of the winter holiday, because La Villa ISD refused to pay the City of La Villa's increased surcharge rate, the city shut off water and sewer services to the schools. They were forced to temporarily close.[10]
In addition, South Texas Independent School District operates magnet schools that serve the community.
References
- ↑ "2019 U.S. Gazetteer Files". United States Census Bureau. Retrieved August 7, 2020.
- 1 2 "US Gazetteer files: 2010, 2000, and 1990". United States Census Bureau. February 12, 2011. Retrieved April 23, 2011.
- 1 2 "Population and Housing Unit Estimates". United States Census Bureau. May 24, 2020. Retrieved May 27, 2020.
- 1 2 "U.S. Census website". United States Census Bureau. Retrieved January 31, 2008.
- ↑ "US Board on Geographic Names". United States Geological Survey. October 25, 2007. Retrieved January 31, 2008.
- ↑ "Census of Population and Housing". Census.gov. Retrieved June 4, 2015.
- ↑ "Explore Census Data". data.census.gov. Retrieved May 21, 2022.
- ↑ https://www.census.gov/
- ↑ "About the Hispanic Population and its Origin". www.census.gov. Retrieved May 18, 2022.
- ↑ "Texas school district closed amid water dispute Archived 2014-04-08 at the Wayback Machine" (Archive). Associated Press at KTXS. January 14, 2014. Retrieved on April 7, 2014.
