

La Niña (/lə ˈniːnjə/ lə NEEN-yə, Spanish: [la ˈniɲa]; lit. 'The Girl') is an oceanic and atmospheric phenomenon that is the colder counterpart of El Niño, as part of the broader El Niño–Southern Oscillation (ENSO) climate pattern. The name La Niña originates from Spanish for "the girl", by analogy to El Niño, meaning "the boy". In the past, it was also called an anti-El Niño[1] and El Viejo, meaning "the old man."[2]
During a La Niña period, the sea surface temperature across the eastern equatorial part of the central Pacific Ocean will be lower than normal by 3–5 °C (5.4–9 °F). An appearance of La Niña often persists for longer than five months. El Niño and La Niña can be indicators of weather changes across the globe. Atlantic and Pacific hurricanes can have different characteristics due to lower or higher wind shear and cooler or warmer sea surface temperatures.
Background

A timeline of all La Niña episodes between 1900 and 2023.[3][4][lower-alpha 1]
La Niña is a complex weather pattern that occurs every few years, as a result of variations in ocean temperatures in the equatorial band of the Pacific Ocean.[1] The phenomenon occurs as strong winds blow warm water at the ocean's surface away from South America, across the Pacific Ocean towards Indonesia.[1] As this warm water moves west, cold water from the deep sea rises to the surface near South America;[1] it is considered to be the cold phase of the broader El Niño–Southern Oscillation (ENSO) weather phenomenon, as well as the opposite of El Niño weather pattern.[1] The movement of so much heat across a quarter of the planet, and particularly in the form of temperature at the ocean surface, can have a significant effect on weather across the entire planet.
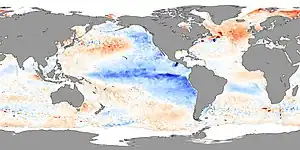
Tropical instability waves visible on sea surface temperature maps, showing a tongue of colder water, are often present during neutral or La Niña conditions.[8]
La Niña events have been observed for hundreds of years, and occurred on a regular basis during the early parts of both the 17th and 19th centuries.[9] Since the start of the 20th century, La Niña events have occurred during the following years:[10][lower-alpha 1]
Impacts on the global climate

La Niña impacts the global climate and disrupts normal weather patterns, which can lead to intense storms in some places and droughts in others.[11]
Regional impacts
Observations of La Niña events since 1950 show that impacts associated with La Niña events depend on what season it is.[12] However, while certain events and impacts are expected to occur during these periods, it is not certain or guaranteed that they will occur.[12]
Africa

La Niña results in wetter-than-normal conditions in southern Africa from December to February, and drier-than-normal conditions over equatorial east Africa over the same period.[14]
Asia
During La Niña years, the formation of tropical cyclones, along with the subtropical ridge position, shifts westward across the western Pacific Ocean, which increases the landfall threat in China.[15] In March 2008, La Niña caused a drop in sea surface temperatures over Southeast Asia by 2 °C (3.6 °F). It also caused heavy rains over the Philippines, Indonesia, and Malaysia.[16]
Australia
Across most of the continent, El Niño and La Niña have more impact on climate variability than any other factor. There is a strong correlation between the strength of La Niña and rainfall: the greater the sea surface temperature and Southern Oscillation difference from normal, the larger the rainfall change.[17]
North America

La Niña causes mostly the opposite effects of El Niño: above-average precipitation across the northern Midwest, the northern Rockies, Northern California, and the Pacific Northwest's southern and eastern regions.[18] Meanwhile, precipitation in the southwestern and southeastern states, as well as southern California, is below average.[19] This also allows for the development of many stronger-than-average hurricanes in the Atlantic and fewer in the Pacific.
The synoptic condition for Tehuantepecer winds is associated with high-pressure system forming in Sierra Madre of Mexico in the wake of an advancing cold front, which causes winds to accelerate through the Isthmus of Tehuantepec. Tehuantepecers primarily occur during the cold season months for the region in the wake of cold fronts, between October and February, with a summer maximum in July caused by the westward extension of the Azores–Bermuda high-pressure system. Wind magnitude is weaker during La Niña years than El Niño years, due to the less frequent cold frontal incursions during La Niña winters,[20] with its effects can last from a few hours to six days.[21] Between 1942 and 1957, La Niña had an impact that caused isotope changes in the plants of Baja California.[22]
In Canada, La Niña will, in general, cause a cooler, snowier winter, such as the near-record-breaking amounts of snow recorded in the La Niña winter of 2007–2008 in eastern Canada.[23][24]
In the spring of 2022, La Niña caused above-average precipitation and below-average temperatures in the state of Oregon. April was one of the wettest months on record, and La Niña effects, while less severe, were expected to continue into the summer.[25]
South America
During a time of La Niña, drought plagues the coastal regions of Peru and Chile.[26] From December to February, northern Brazil is wetter than normal.[26] La Niña causes higher than normal rainfall in the central Andes, which in turn causes catastrophic flooding on the Llanos de Mojos of Beni Department, Bolivia. Such flooding is documented from 1853, 1865, 1872, 1873, 1886, 1895, 1896, 1907, 1921, 1928, 1929 and 1931.[27]
Variations

The ‘traditional’ or conventional La Niña is called an Eastern Pacific (EP) La Niña;[28] it involves temperature anomalies in the eastern Pacific. However, aside from differences in diagnostic criteria,[lower-alpha 1] non-traditional La Niñas were observed in the last two decades, in which the usual place of the temperature anomaly (Niño 1 and 2) is not affected, but rather an anomaly arises in the central Pacific (Niño 3.4).[29] The phenomenon is called Central Pacific (CP) La Niña,[28] dateline La Niña (because the anomaly arises near the dateline), or La Niña "Modoki" ("Modoki" is Japanese for "alternate / meta / similar-but-different").[30][31][32]
The effects of the CP La Niña similarly contrast with the EP La Niña – it strongly tends to increase rainfall over northwestern Australia and northern Murray–Darling basin, rather than over the east as in a conventional La Niña.[31] Also, La Niña Modoki increases the frequency of cyclonic storms over Bay of Bengal, but decreases the occurrence of severe storms in the Indian Ocean overall, with the Arabian Sea becoming severely non-conducive to tropical cyclone formation.[33][34]
Recent years when La Niña Modoki events occurred include 1973–1974, 1975–1976, 1983–1984, 1988–1989, 1998–1999, 2000–2001, 2008–2009, 2010–2011, and 2016–2017.[30][35][36]
See also
- 2000 Mozambique flood (attributed to La Niña)
- 2010 Pakistan floods (attributed to La Niña)
- 2010–2011 Queensland floods (attributed to La Niña)
- 2010–2012 La Niña event
- 2010–2011 Southern Africa floods (attributed to La Niña)
- 2010–2013 Southern United States and Mexico drought (attributed to La Niña)
- 2011 East Africa drought (attributed to La Niña)
- 2020 Atlantic hurricane season (unprecedented severity fueled by La Niña)
- 2021 New South Wales floods (severity fueled by La Niña)
- March 2022 Suriname flooding (attributed to La Niña)
- 2023 Auckland Anniversary Weekend floods (attributed to La Niña)
- Ocean dynamical thermostat
- Walker circulation
Footnotes
- 1 2 3 Each forecast agency has a different criteria for what constitutes a La Niña event, which is tailored to their specific interests.[5] For example, the Australian Bureau of Meteorology looks at the trade winds, SOI, weather models and sea surface temperatures in the Niño 3 and 3.4 regions before declaring that a La Niña event has started.[6] However, the Japan Meteorological Agency declares that a La Niña event has started when the average five-month sea surface temperature deviation for the NINO 3 region is more than 0.5 °C (0.90 °F) cooler for six consecutive months or longer.[7]
References
- 1 2 3 4 5 "What are "El Niño" and "La Niña"?". National Ocean Service. oceanservice.noaa.gov. National Oceanic and Atmospheric Administration. 10 February 2020. Retrieved 11 September 2020.
- ↑ "What is "La Niña"?". Tropical Atmosphere Ocean project / Pacific Marine Environmental Laboratory. National Oceanic and Atmospheric Administration. 24 March 2008. Retrieved 17 July 2009.
- ↑ Cold and warm episodes by season. Climate Prediction Center (Report). National Oceanic and Atmospheric Administration. Retrieved 11 September 2020.
- ↑ La Niña – Detailed Australian analysis (Report). Australian Bureau of Meteorology. Retrieved 3 April 2016.
- ↑ Becker, Emily (4 December 2014). "December's ENSO Update: Close, but no cigar". ENSO Blog. Archived from the original on 22 March 2016. Retrieved 4 April 2016.
- ↑ "ENSO Tracker: About ENSO and the Tracker". Australian Bureau of Meteorology. Retrieved 4 April 2016.
- ↑ "Historical El Niño and La Niña Events". Japan Meteorological Agency. Retrieved 4 April 2016.
- ↑ "August 2016 ENSO update;Wavy Gravy". Climate.gov.uk. Retrieved 16 October 2021.
- ↑ Druffel, Ellen R. M.; Griffin, Sheila; Vetter, Desiree; Dunbar, Robert B.; Mucciarone, David M. (16 March 2015). "Identification of frequent La Niña events during the early 1800s in the east equatorial Pacific". Geophysical Research Letters. 42 (5): 1512–1519. Bibcode:2015GeoRL..42.1512D. doi:10.1002/2014GL062997. S2CID 129644802. Retrieved 26 February 2022.
- ↑ "El Niño and La Niña". New Zealand: National Institute of Water and Atmospheric Research. 27 February 2007. Archived from the original on 19 March 2016. Retrieved 11 April 2016.
- 1 2 Barnston, Anthony (19 May 2014). "How ENSO leads to a cascade of global impacts". ENSO Blog. Archived from the original on 26 May 2016.
- ↑ "Slow response to East Africa famine 'cost lives'". BBC News. 18 January 2012. Retrieved 27 February 2022.
- ↑ "La Niña weather likely to last for months". Scoop News (Scoop.co.nz). 12 October 2010. Retrieved 27 February 2022.
- ↑ Wu, M. C.; Chang, W. L.; Leung, W. M. (2004). "Impacts of El Niño–Southern Oscillation events on tropical cyclone landfalling activity in the western north Pacific". Journal of Climate. 17 (6): 1419–1428. Bibcode:2004JCli...17.1419W. CiteSeerX 10.1.1.461.2391. doi:10.1175/1520-0442(2004)017<1419:ioenoe>2.0.co;2.
- ↑ Hong, Lynda (13 March 2008). "Recent heavy rain not caused by global warming". Channel News Asia. Archived from the original on 14 May 2008. Retrieved 22 June 2008.
- ↑ Power, Scott; Haylock, Malcolm; Colman, Rob; Wang, Xiangdong (1 October 2006). "The Predictability of Interdecadal Changes in ENSO Activity and ENSO Teleconnections". Journal of Climate. 19 (19): 4755–4771. Bibcode:2006JCli...19.4755P. doi:10.1175/JCLI3868.1. ISSN 0894-8755. S2CID 55572677. Retrieved 25 September 2020.
- ↑ "La Niña is coming. Here's what that means for winter weather in the U.S." NPR. 22 October 2021. Retrieved 21 December 2021.
- ↑ "ENSO Diagnostic Discussion". Climate Prediction Center. National Oceanic and Atmospheric Administration. 5 June 2014. Archived from the original on 26 June 2014.
- ↑ Romero-Centeno, Rosario; Zavala-Hidalgo, Jorge; Gallegos, Artemio; O’Brien, James J. (August 2003). "Isthmus of Tehuantepec wind climatology and ENSO signal". Journal of Climate. 16 (15): 2628–2639. Bibcode:2003JCli...16.2628R. doi:10.1175/1520-0442(2003)016<2628:iotwca>2.0.co;2. S2CID 53654865.
- ↑ Arnerich, Paul A. "Tehuantepecer Winds of the west coast of Mexico". Mariners Weather Log. 15 (2): 63–67.
- ↑ Martínez-Ballesté, Andrea; Ezcurra, Exequiel (2018). "Reconstruction of past climatic events using oxygen isotopes in Washingtonia robusta growing in three anthropic oases in Baja California". Boletín de la Sociedad Geológica Mexicana. 70 (1): 79–94. doi:10.18268/BSGM2018v70n1a5.
- ↑ "A never-ending winter". Canada's top ten weather stories for 2008. Environment Canada. 29 December 2008. number 3. Archived from the original on 7 August 2011.
- ↑ ENSO evolution, status, and forecasts (PDF). Climate Prediction Center (Report) (update ed.). National Oceanic and Atmospheric Administration. 28 February 2005. Archived from the original (PDF) on 15 May 2005.
- ↑ "If la Niña continues, what does that mean for Oregon this summer?". 29 April 2022.
- 1 2 "La Niña follows El Niño, the GLOBE El Niño Experiment continues". Archived from the original on 15 October 2011. Retrieved 31 May 2010.
- ↑ van Valen, Gary (2013). Indigenous Agency in the Amazon. Tucson, Arizona: University of Arizona Press. p. 10.
- 1 2 Kao, Hsun-Ying; Yu, Jin-Yi (2009). "Contrasting eastern-Pacific and central-Pacific types of ENSO" (PDF). Journal of Climate. 22 (3): 615–632. Bibcode:2009JCli...22..615K. CiteSeerX 10.1.1.467.457. doi:10.1175/2008JCLI2309.1.
- ↑ Larkin, N. K.; Harrison, D. E. (2005). "On the definition of El Niño and associated seasonal average U.S. weather anomalies". Geophysical Research Letters. 32 (13): L13705. Bibcode:2005GeoRL..3213705L. doi:10.1029/2005GL022738.
- 1 2 Yuan, Yuan; Yan, HongMing (2012). "Different types of La Niña events and different responses of the tropical atmosphere". Chinese Science Bulletin. 58 (3): 406–415. Bibcode:2013ChSBu..58..406Y. doi:10.1007/s11434-012-5423-5.
- 1 2 Cai, W.; Cowan, T. (2009). "La Niña Modoki impacts Australia autumn rainfall variability". Geophysical Research Letters. 36 (12): L12805. Bibcode:2009GeoRL..3612805C. doi:10.1029/2009GL037885. ISSN 0094-8276.
- ↑ Johnson, Nathaniel C. (2013). "How many ENSO flavors can we distinguish?". Journal of Climate. 26 (13): 4816–27. Bibcode:2013JCli...26.4816J. doi:10.1175/JCLI-D-12-00649.1.
- ↑ Kumar, M. R. Ramesh (23 April 2014). El Nino, La Niña and the Indian sub-continent (Report). Society for Environmental Communications. Retrieved 25 July 2014.
- ↑ Sumesh, K.G.; Kumar, M. R. Ramesh (10 March 2014). "Tropical cyclones over NIO during La Niña Modoki years" (PDF). Indian Journal of Geo-Marine Sciences. Retrieved 18 February 2017.
- ↑ Tedeschi, Renata G.; Cavalcanti, Iracema F. A. (23 April 2014). "Influência dos ENOS Canônico e Modoki na precipitação da América do Sul" (PDF) (in Portuguese). Instituto Nacional de Pesquisas Espaciais/Centro de Previsão de Tempo e Estudos Climáticos. Archived from the original (PDF) on 23 October 2014. Retrieved 27 September 2014.
External links
- "Current map of sea surface temperature anomalies in the Pacific Ocean". earth.nullschool.net.
- "Southern Oscillation diagnostic discussion". Climate Prediction Center (CPC). National Oceanic and Atmospheric Administration.
- "ENSO Outlook – An alert system for the El Niño–Southern Oscillation". Australian Bureau of Meteorology.