Puerto Boyacá | |
|---|---|
Municipality and town | |
 Flag  Seal | |
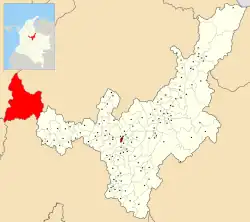 Location of the municipality and town of Puerto Boyacá in the Boyacá Department of Colombia | |
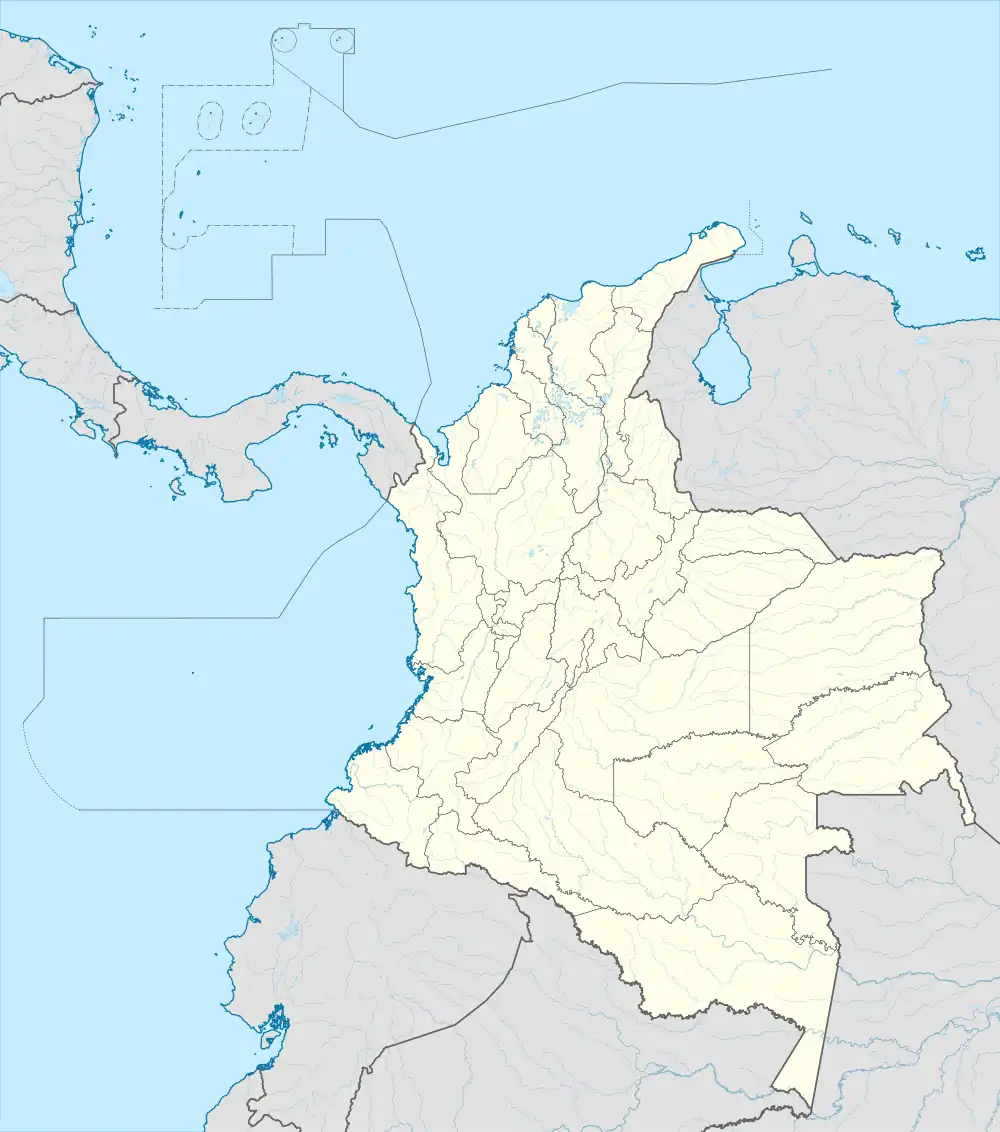 Puerto Boyacá Location in Colombia | |
| Coordinates: 5°58′41″N 74°35′23″W / 5.97806°N 74.58972°W | |
| Country | |
| Department | Boyacá Department |
| Province | Boyacá Special Handling Zone |
| Founded | December 14, 1957 |
| Government | |
| • Mayor | Jicly Esgardo Mutis Isaza (2020-2023) |
| Area | |
| • Municipality and town | 1,514 km2 (585 sq mi) |
| • Urban | 4.08 km2 (1.58 sq mi) |
| Elevation | 145 m (476 ft) |
| Population (2018 census)[1] | |
| • Municipality and town | 46,736 |
| • Density | 31/km2 (80/sq mi) |
| • Urban | 32,979 |
| • Urban density | 8,100/km2 (21,000/sq mi) |
| Demonym | Puertoboyacense |
| Time zone | UTC-5 (Colombia Standard Time) |
| Postal code | 152201-19 |
| Area code | 57 + 8 |
| Website | Official website |
Puerto Boyacá is a Colombian river-port town and municipality by the Magdalena River in the Boyacá Department, where is also considered a Special Trade Zone due to its port status. Its main industries are oil exploration and processing. In the 1980s and early 1990s, Puerto Boyacá was affected intensively by the Colombian Armed Conflict.
Borders
- North - departments of Bolívar, Santander
- West - Magdalena River and Puerto Berrío, Puerto Nare, Puerto Triunfo and Sonsón municipalities of Antioquia Department
- South - Puerto Salgar and Yacopí municipalities of Cundinamarca
- East - municipality of Otanche (Boyacá)
Born in Puerto Boyacá
- Fredy Guarín, Colombian football player
Gallery
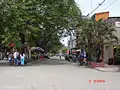 Puerto Boyacá typical street
- El Centro de la ciudad. Downtown city.
Other information
- Market Day: Sunday
- Distance from Tunja: 373 km
- Median temperature: 32 °C
Climate
| Month | Jan | Feb | Mar | Apr | May | Jun | Jul | Aug | Sep | Oct | Nov | Dec | Year |
|---|---|---|---|---|---|---|---|---|---|---|---|---|---|
| Record high °C (°F) | 38.6 (101.5) |
39.4 (102.9) |
40.0 (104.0) |
37.4 (99.3) |
37.0 (98.6) |
38.0 (100.4) |
41.2 (106.2) |
41.2 (106.2) |
39.0 (102.2) |
37.4 (99.3) |
37.4 (99.3) |
37.4 (99.3) |
38.7 (101.7) |
| Mean daily maximum °C (°F) | 32.7 (90.9) |
33.0 (91.4) |
32.3 (90.1) |
32.2 (90.0) |
32.3 (90.1) |
32.9 (91.2) |
33.6 (92.5) |
33.8 (92.8) |
32.5 (90.5) |
31.5 (88.7) |
31.4 (88.5) |
32.0 (89.6) |
32.5 (90.5) |
| Daily mean °C (°F) | 28.1 (82.6) |
28.1 (82.6) |
27.8 (82.0) |
27.7 (81.9) |
27.8 (82.0) |
27.9 (82.2) |
28.4 (83.1) |
28.3 (82.9) |
27.6 (81.7) |
27.0 (80.6) |
27.2 (81.0) |
27.6 (81.7) |
27.6 (81.7) |
| Mean daily minimum °C (°F) | 23.4 (74.1) |
23.7 (74.7) |
23.4 (74.1) |
23.2 (73.8) |
23.1 (73.6) |
23.4 (74.1) |
23.2 (73.8) |
23.3 (73.9) |
22.9 (73.2) |
22.8 (73.0) |
23.3 (73.9) |
23.7 (74.7) |
23.3 (73.9) |
| Record low °C (°F) | 20.0 (68.0) |
20.2 (68.4) |
18.0 (64.4) |
17.4 (63.3) |
16.8 (62.2) |
20.0 (68.0) |
20.2 (68.4) |
20.0 (68.0) |
19.0 (66.2) |
19.4 (66.9) |
20.0 (68.0) |
20.6 (69.1) |
19.3 (66.7) |
| Average precipitation mm (inches) | 64 (2.5) |
112 (4.4) |
153 (6.0) |
246 (9.7) |
234 (9.2) |
154 (6.1) |
143 (5.6) |
155 (6.1) |
239 (9.4) |
295 (11.6) |
191 (7.5) |
99 (3.9) |
2,086 (82.1) |
| Average rainy days (≥ 1 mm) | 7 | 11 | 13 | 18 | 20 | 18 | 16 | 16 | 19 | 21 | 16 | 10 | 183 |
| Average relative humidity (%) | 76 | 76 | 78 | 80 | 80 | 78 | 75 | 74 | 78 | 81 | 81 | 79 | 78 |
| Source: Instituto de Hidrología, Meteorología y Estudios Ambientales (IDEAM)[2] | |||||||||||||
References
- ↑ Citypopulation.de
- ↑ "Promedios 71-00" (in Spanish). IDEAM. Retrieved 30 April 2019.
External links
- (in Spanish) Puerto Boyacá municipality official website
6°00′N 74°25′W / 6.000°N 74.417°W
This article is issued from Wikipedia. The text is licensed under Creative Commons - Attribution - Sharealike. Additional terms may apply for the media files.