
| Part of a series on |
| Weather |
|---|
|
|
Severe weather is any dangerous meteorological phenomenon with the potential to cause damage, serious social disruption, or loss of human life.[1][2][3] Types of severe weather phenomena vary, depending on the latitude, altitude, topography, and atmospheric conditions. High winds, hail, excessive precipitation, and wildfires are forms and effects of severe weather, as are thunderstorms, downbursts, tornadoes, waterspouts, tropical cyclones, and extratropical cyclones. Regional and seasonal severe weather phenomena include blizzards (snowstorms), ice storms, and duststorms.[4]
Severe weather is one type of extreme weather, which includes unexpected, unusual, severe, or unseasonal weather and is by definition rare for that location or time of the year.[5] Due to the effects of climate change, the frequency and intensity of some of the extreme weather events are increasing, for example, heatwaves and droughts.[6]: 9
Terminology
Meteorologists have generally defined severe weather as any aspect of the weather that poses risks to life or property or requires the intervention of authorities. A narrower definition of severe weather is any weather phenomenon relating to severe thunderstorms.[4][7]
According to the World Meteorological Organization (WMO), severe weather can be categorized into two groups: general severe weather and localized severe weather.[1] Nor'easters, European wind storms, and the phenomena that accompany them form over wide geographic areas. These occurrences are classified as general severe weather.[1] Downbursts and tornadoes are more localized and therefore have a more limited geographic effect. These forms of weather are classified as localized severe weather.[1]
The term severe weather is technically not the same phenomenon as extreme weather. Extreme weather describes unusual weather events that are at the extremes of the historical distribution for a given area.[8]
Causes
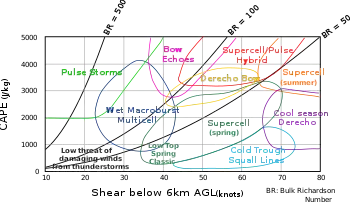
Organized severe weather occurs under the same conditions that generate ordinary thunderstorms: atmospheric moisture, lift (often from thermals), and instability.[9] A wide variety of conditions cause severe weather. Several factors can convert thunderstorms into severe weather. For example, a pool of cold air aloft may aid in the development of large hail from an otherwise innocuous-appearing thunderstorm. However, the most severe hail and tornadoes are produced by supercell thunderstorms, and the worst downbursts and derechos (straight-line winds) are produced by bow echoes. Both of these types of storms tend to form in environments with high wind shear.[9]
Floods, hurricanes, tornadoes, and thunderstorms are considered to be the most destructive weather-related natural disasters. Although these weather phenomena are all related to cumulonimbus clouds, they form and develop under different conditions and geographic locations. The relationship between these weather events and their formation requirements is used to develop models to predict the most frequent and possible locations. This information is used to notify affected areas and save lives.
Categories

Severe thunderstorms can be assessed in three different categories. These are "approaching severe", "severe", and "significantly severe".
Approaching severe is defined as hail between 1⁄2 to 1 inch (13 to 25 mm) diameter or winds between 50 and 58 mph (50 knots, 80–93 km/h). In the United States, such storms will usually warrant a Significant Weather Alert.[10]
Severe is defined as hail 1 to 2 inches (25 to 51 mm) diameter, winds 58 to 75 miles per hour (93 to 121 km/h), or a tornado.[11]
Significant severe is defined as hail 2 inches (51 mm) in diameter or larger, winds 75 mph (65 knots, 120 km/h) or more, or a tornado of strength EF2 or stronger.[1][12]
Both severe and significant severe events warrant a severe thunderstorm warning from the United States National Weather Service (excludes flash floods), the Environment Canada, the Australian Bureau of Meteorology, the Meteorological Service of New Zealand and the Meteorological Office UK, if the event occurs in those countries. If a tornado is occurring (a tornado has been seen by spotters) or is imminent (Doppler weather radar has observed strong rotation in a storm, indicating an incipient tornado), the severe thunderstorm warning will be superseded by a tornado warning in the United States and Canada.[13]
A severe weather outbreak is typically considered to be when ten or more tornadoes, some of which will likely be long-tracked and violent, and many large hail or damaging wind reports occur within one or more consecutive days. Severity is also dependent on the size of the geographic area affected, whether it covers hundreds or thousands of square kilometers.[14]
High winds

High winds are known to cause damage, depending upon their strength.
Wind speeds as low as 23 knots (43 km/h) may lead to power outages when tree branches fall and disrupt power lines.[15] Some species of trees are more vulnerable to winds. Trees with shallow roots are more prone to uproot, and brittle trees such as eucalyptus, sea hibiscus, and avocado are more prone to branch damage.[16]
Wind gusts may cause poorly designed suspension bridges to sway. When wind gusts harmonize with the frequency of the swaying bridge, the bridge may fail as occurred with the Tacoma Narrows Bridge in 1940.[17]
Hurricane-force winds, caused by individual thunderstorms, thunderstorm complexes, derechos, tornadoes, extratropical cyclones, or tropical cyclones can destroy mobile homes and structurally damage buildings with foundations. Winds of this strength due to downslope winds off terrain have been known to shatter windows and sandblast paint from cars.[18]
Once winds exceed 135 knots (250 km/h) within strong tropical cyclones and tornadoes, homes completely collapse, and significant damage is done to larger buildings. Total destruction to man-made structures occurs when winds reach 175 knots (324 km/h). The Saffir–Simpson scale for cyclones and Enhanced Fujita scale (TORRO scale in Europe) for tornadoes were developed to help estimate wind speed from the damage they cause.[19][20]
Tornado

A dangerous rotating column of air in contact with both the surface of the earth and the base of a cumulonimbus cloud (thundercloud) or a cumulus cloud, in rare cases. Tornadoes come in many sizes but typically form a visible condensation funnel whose narrowest end reaches the earth and surrounded by a cloud of debris and dust.[21]
Tornadoes' wind speeds generally average between 40 miles per hour (64 km/h) and 110 miles per hour (180 km/h). They are approximately 250 feet (76 m) across and travel a few miles (kilometers) before dissipating. Some attain wind speeds in excess of 300 miles per hour (480 km/h), may stretch more than two miles (3.2 km) across, and maintain contact with the ground for dozens of miles (more than 100 km).[22][23][24] The Enhanced Fujita Scale and the TORRO Scale are two examples of scales used to rate the strength, intensity and/or damage of a tornado.
Tornadoes, despite being one of the most destructive weather phenomena, are generally short-lived. A long-lived tornado generally lasts no more than an hour, but some have been known to last for 2 hours or longer (for example, the Tri-State Tornado). Due to their relatively short duration, less information is known about the development and formation of tornadoes.[25]
Waterspout
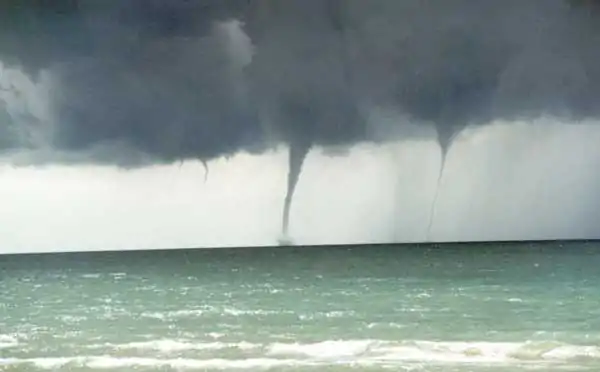
Waterspouts are generally defined as tornadoes or non-supercell tornadoes that develop over bodies of water.[26]
Waterspouts typically do not do much damage because they occur over open water, but they are capable of traveling over land. Vegetation, weakly constructed buildings, and other infrastructure may be damaged or destroyed by waterspouts. Waterspouts do not generally last long over terrestrial environments as the friction produced easily dissipates the winds. Strong horizontal winds will cause waterspouts to dissipate as they disturb the vortex.[27] While not generally as dangerous as "classic" tornadoes, waterspouts can overturn boats, and they can cause severe damage to larger ships.[13]
Downburst and derecho
Downbursts are created within thunderstorms by significantly rain-cooled air, which, upon reaching ground level, spreads out in all directions and produce strong winds. Unlike winds in a tornado, winds in a downburst are not rotational but are directed outwards from the point where they strike land or water.

"Dry downbursts" are associated with thunderstorms with very little precipitation,[28] while wet downbursts are generated by thunderstorms with large amounts of rainfall. Microbursts are very small downbursts with winds that extend up to 2.5 miles (4 km) from their source, while macrobursts are large-scale downbursts with winds that extend in excess of 2.5 miles (4 km).[29] The heat burst is created by vertical currents on the backside of old outflow boundaries and squall lines where rainfall is lacking. Heat bursts generate significantly higher temperatures due to the lack of rain-cooled air in their formation.[30] Derechos are longer, usually stronger, forms of downburst winds characterized by straight-lined windstorms.[31][32]
Downbursts create vertical wind shear or microbursts, which are dangerous to aviation.[33] These convective downbursts can produce damaging winds, lasting 5 to 30 minutes, with wind speeds as high as 168 mph (75 m/s), and cause tornado-like damage on the ground. Downbursts also occur much more frequently than tornadoes, with ten downburst damage reports for every one tornado.[34]
Squall line
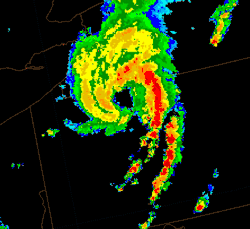
A squall line is an elongated line of severe thunderstorms that can form along or ahead of a cold front.[35][36] The squall line typically contains heavy precipitation, hail, frequent lightning, strong straight line winds, and possibly tornadoes or waterspouts.[37] Severe weather in the form of strong straight-line winds can be expected in areas where the squall line forms a bow echo, in the farthest portion of the bow.[38] Tornadoes can be found along waves within a line echo wave pattern (LEWP) where mesoscale low-pressure areas are present.[39] Intense bow echoes responsible for widespread, extensive wind damage are called derechos, and move quickly over large territories.[31] A wake low or a mesoscale low-pressure area forms behind the rain shield (a high pressure system under the rain canopy) of a mature squall line and is sometimes associated with a heat burst.[40]
Squall lines often cause severe straight-line wind damage, and most non-tornadic wind damage is caused from squall lines.[41] Although the primary danger from squall lines is straight-line winds, some squall lines also contain weak tornadoes.[41]
Tropical cyclone
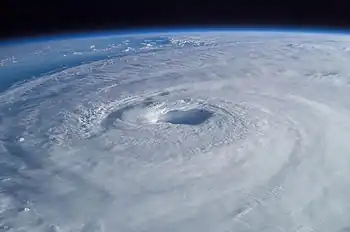
Very high winds can be caused by mature tropical cyclones (called hurricanes in the United States and Canada and typhoons in eastern Asia). A tropical cyclone's heavy surf created by such winds may cause harm to marine life either close to or upon the surface of the water, such as coral reefs.[42] Coastal regions may receive significant damage from a tropical cyclone while inland regions are relatively safe from the strong winds, due to their rapid dissipation over land. However, severe flooding can occur even far inland because of high amounts of rain from tropical cyclones and their remnants.
Strong extratropical cyclones

Severe local windstorms in Europe that develop from winds off the North Atlantic. These windstorms are commonly associated with the destructive extratropical cyclones and their low pressure frontal systems.[43] European windstorms occur mainly in the seasons of autumn and winter.[44] Severe European windstorms are often characterized by heavy precipitation as well.
A synoptic-scale extratropical storm along the upper East Coast of the United States and Atlantic Canada is called a Nor'easter. They are so named because their winds come from the northeast, especially in the coastal areas of the Northeastern United States and Atlantic Canada. More specifically, it describes a low-pressure area whose center of rotation is just off the upper East Coast and whose leading winds in the left forward quadrant rotate onto land from the northeast. Nor'easters may cause coastal flooding, coastal erosion, heavy rain or snow, and hurricane-force winds. The precipitation pattern of Nor'easters is similar to other mature extratropical storms. Nor'easters can cause heavy rain or snow, either within their comma-head precipitation pattern or along their trailing cold or stationary front. Nor'easters can occur at any time of the year but are mostly known for their presence in the winter season.[45]
Dust storm
A dust storm is an unusual form of windstorm that is characterized by the existence of large quantities of sand and dust particles carried by the wind.[46] Dust storms frequently develop during periods of droughts, or over arid and semi-arid regions.

Dust storms have numerous hazards and are capable of causing deaths. Visibility may be reduced dramatically, so risks of vehicle and aircraft crashes are possible. Additionally, the particulates may reduce oxygen intake by the lungs,[47] potentially resulting in suffocation. Damage can also be inflicted upon the eyes due to abrasion.[48]
Dust storms can many issues for agricultural industries as well. Soil erosion is one of the most common hazards and decreases arable lands. Dust and sand particles can cause severe weathering of buildings and rock formations. Nearby bodies of water may be polluted by settling dust and sand, killing aquatic organisms. Decrease in exposure to sunlight can affect plant growth, as well as decrease in infrared radiation may cause decreased temperatures.
Wildfires

The most common cause of wildfires varies throughout the world. In the United States, Canada, and Northwest China, lightning is the major source of ignition. In other parts of the world, human involvement is a major contributor. For instance, in Mexico, Central America, South America, Africa, Southeast Asia, Fiji, and New Zealand, wildfires can be attributed to human activities such as animal husbandry, agriculture, and land-conversion burning. Human carelessness is a major cause of wildfires in China and in the Mediterranean Basin. In Australia, the source of wildfires can be traced to both lightning strikes and human activities such as machinery sparks and cast-away cigarette butts."[49] Wildfires have a rapid forward rate of spread (FROS) when burning through dense, uninterrupted fuels.[50] They can move as fast as 10.8 kilometers per hour (6.7 mph) in forests and 22 kilometers per hour (14 mph) in grasslands.[51] Wildfires can advance tangential to the main front to form a flanking front, or burn in the opposite direction of the main front by backing.[52]
Wildfires may also spread by jumping or spotting as winds and vertical convection columns carry firebrands (hot wood embers) and other burning materials through the air over roads, rivers, and other barriers that may otherwise act as firebreaks.[53][54] Torching and fires in tree canopies encourage spotting, and dry ground fuels that surround a wildfire are especially vulnerable to ignition from firebrands.[55] Spotting can create spot fires as hot embers and firebrands ignite fuels downwind from the fire. In Australian bushfires, spot fires are known to occur as far as 10 kilometers (6 mi) from the fire front.[56] Since the mid-1980s, earlier snowmelt and associated warming has also been associated with an increase in length and severity of the wildfire season in the Western United States.[57]
Hail

Any form of thunderstorm that produces precipitating hailstones is known as a hailstorm.[58] Hailstorms are generally capable of developing in any geographic area where thunderclouds (cumulonimbus) are present, although they are most frequent in tropical and monsoon regions.[59] The updrafts and downdrafts within cumulonimbus clouds cause water molecules to freeze and solidify, creating hailstones and other forms of solid precipitation.[60] Due to their larger density, these hailstones become heavy enough to overcome the density of the cloud and fall towards the ground. The downdrafts in cumulonimbus clouds can also cause increases in the speed of the falling hailstones. The term hailstorm is usually used to describe the existence of significant quantities or size of hailstones.
Hailstones can cause serious damage, notably to automobiles, aircraft, skylights, glass-roofed structures, livestock, and crops.[61] Rarely, massive hailstones have been known to cause concussions or fatal head trauma. Hailstorms have been the cause of costly and deadly events throughout history. One of the earliest recorded incidents occurred around the 12th century in Wellesbourne, Britain.[62] The largest hailstone in terms of maximum circumference and length ever recorded in the United States fell in 2003 in Aurora, Nebraska, USA. The hailstone had a diameter of 7 inches (18 cm) and a circumference of 18.75 inches (47.6 cm).[63]
Heavy rainfall and flooding
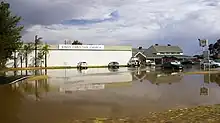
Heavy rainfall can lead to a number of hazards, most of which are floods or hazards resulting from floods. Flooding is the inundation of areas that are not normally under water. It is typically divided into three classes: River flooding, which relates to rivers rising outside their normal banks; flash flooding, which is the process where a landscape, often in urban and arid environments, is subjected to rapid floods;[64] and coastal flooding, which can be caused by strong winds from tropical or non-tropical cyclones.[65] Meteorologically, excessive rains occur within a plume of air with high amounts of moisture (also known as an atmospheric river), which is directed around an upper level cold-core low or a tropical cyclone.[66] Flash flooding can frequently occur in slow-moving thunderstorms and are usually caused by the heavy liquid precipitation that accompanies it. Flash floods are most common in densely populated urban environments, where less plants and bodies of water are presented to absorb and contain the extra water. Flash flooding can be hazardous to small infrastructure, such as bridges, and weakly constructed buildings. Plants and crops in agricultural areas can be destroyed and devastated by the force of raging water. Automobiles parked within experiencing areas can also be displaced. Soil erosion can occur as well, exposing risks of landslide phenomena. Like all forms of flooding phenomenon, flash flooding can also spread and produce waterborne and insect-borne diseases cause by microorganisms. Flash flooding can be caused by extensive rainfall released by tropical cyclones of any strength or the sudden thawing effect of ice dams.[67][68]
Monsoons
Seasonal wind shifts lead to long-lasting wet seasons, which produce the bulk of annual precipitation in areas such as Southeast Asia, Australia, Western Africa, eastern South America, Mexico, and the Philippines. Widespread flooding occurs if rainfall is excessive,[69] which can lead to landslides and mudflows in mountainous areas.[70] Floods cause rivers to exceed their capacity with nearby buildings becoming submerged.[71] Flooding may be exacerbated if there are fires during the previous dry season. This may cause soils that are sandy or composed of loam to become hydrophobic and repel water.[72]
Government organizations help their residents deal with wet-season floods though floodplain mapping and information on erosion control. Mapping is conducted to help determine areas that may be more prone to flooding.[73] Erosion control instructions are provided through outreach over the telephone or the internet.[74]
Flood waters that occur during monsoon seasons can often host numerous protozoa, bacterial, and viral microorganisms.[75] Mosquitoes and flies will lay their eggs within the contaminated bodies of water. These disease agents may cause infections of foodborne and waterborne diseases. Diseases associated with exposure to flood waters include malaria, cholera, typhoid, hepatitis A, and the common cold.[76] Possible trench foot infections may also occur when personnel are exposed for extended periods of time within flooded areas.[77]
Tropical cyclone

A tropical cyclone is a rapidly rotating storm system characterized by a low-pressure center, a closed low-level atmospheric circulation, strong winds, and a spiral arrangement of thunderstorms that produce heavy rain or squalls. A tropical cyclone feeds on heat released when moist air rises, resulting in condensation of water vapor contained in the moist air. Tropical cyclones may produce torrential rain, high waves, and damaging storm surge.[78] Heavy rains produce significant inland flooding. Storm surges may produce extensive coastal flooding up to 40 kilometres (25 mi) from the coastline.
Although cyclones take an enormous toll in lives and personal property, they are also important factors in the precipitation regimes of areas they affect. They bring much-needed precipitation to otherwise dry regions.[79] Areas in their path can receive a year's worth of rainfall from a tropical cyclone passage.[80] Tropical cyclones can also relieve drought conditions.[81] They also carry heat and energy away from the tropics and transport it toward temperate latitudes, which makes them an important part of the global atmospheric circulation mechanism. As a result, tropical cyclones help to maintain equilibrium in the Earth's troposphere.
Severe winter weather
Heavy snowfall
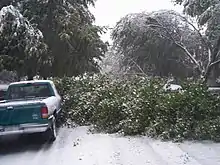
When extratropical cyclones deposit heavy, wet snow with a snow-water equivalent (SWE) ratio of between 6:1 and 12:1 and a weight in excess of 10 pounds per square foot (~50 kg/m2)[82] piles onto trees or electricity lines, significant damage may occur on a scale usually associated with strong tropical cyclones.[83] An avalanche can occur with a sudden thermal or mechanical impact on snow that has accumulated on a mountain, which causes the snow to rush downhill suddenly. Preceding an avalanche is a phenomenon known as an avalanche wind caused by the approaching avalanche itself, which adds to its destructive potential.[84] Large amounts of snow that accumulate on top of man-made structures can lead to structural failure.[85] During snowmelt, acidic precipitation that previously fell in the snow pack is released and harms marine life.[86]
Lake-effect snow is produced in the winter in the shape of one or more elongated bands. This occurs when cold winds move across long expanses of warmer lake water, providing energy and picking up water vapor, which then freezes and is deposited on the lee shores.[87] For more information on this effect see the main article.
Conditions within blizzards often include large quantities of blowing snow and strong winds that may significantly reduce visibility. Reduced viability of personnel on foot may result in extended exposure to the blizzard and increase the chance of becoming lost. The strong winds associated with blizzards create wind chill that can result in frostbites and hypothermia. The strong winds present in blizzards are capable of damaging plants and may cause power outages, frozen pipes, and cut off fuel lines.[88]
Ice storm

Ice storms are also known as a Silver storm, referring to the color of the freezing precipitation.[89] Ice storms are caused by liquid precipitation which freezes upon cold surfaces and leads to the gradual development of a thickening layer of ice.[89] The accumulations of ice during the storm can be extremely destructive. Trees and vegetation can be destroyed and in turn may bring down power lines, causing the loss of heat and communication lines.[90] Roofs of buildings and automobiles may be severely damaged. Gas pipes can become frozen or even damaged causing gas leaks. Avalanches may develop due to the extra weight of the ice present. Visibility can be reduced dramatically. The aftermath of an ice storm may result in severe flooding due to sudden thawing, with large quantities of displaced water, especially near lakes, rivers, and bodies of water.[91]
Heat and drought
Drought
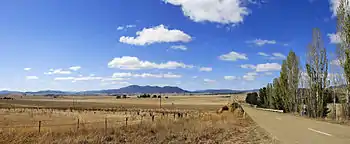
Another form of severe weather is drought, which is a prolonged period of persistently dry weather (that is, absence of precipitation).[92] Although droughts do not develop or progress as quickly as other forms of severe weather,[93] their effects can be just as deadly; in fact, droughts are classified and measured based upon these effects.[92] Droughts have a variety of severe effects; they can cause crops to fail,[93] and they can severely deplete water resources, sometimes interfering with human life.[92] A drought in the 1930s known as the Dust Bowl affected 50 million acres of farmland in the central United States.[92] In economic terms, they can cost many billions of dollars: a drought in the United States in 1988 caused over $40 billion in losses,[94] exceeding the economic totals of Hurricane Andrew, the Great Flood of 1993, and the 1989 Loma Prieta earthquake.[93] In addition to the other severe effects, the dry conditions caused by droughts also significantly increase the risk of wildfires.[92]
Heat waves

Although official definitions vary, a heat wave is generally defined as a prolonged period with excessive heat.[95] Although heat waves do not cause as much economic damage as other types of severe weather, they are extremely dangerous to humans and animals: according to the United States National Weather Service, the average total number of heat-related fatalities each year is higher than the combined total fatalities for floods, tornadoes, lightning strikes, and hurricanes.[96] In Australia, heat waves cause more fatalities than any other type of severe weather.[95] The dry conditions that may accompany heat waves can also severely affect plant life as the plants lose moisture and die.[97] Heat waves are often more severe when combined with high humidity.[96]
See also
References
- 1 2 3 4 5 World Meteorological Organization (October 2004). "Workshop On Severe and ExPOO Events Forecasting". Archived from the original on 3 January 2017. Retrieved 18 August 2009.
- ↑ "Severe Weather 101 – NOAA National Severe Storms Laboratory". nssl.noaa.gov. Archived from the original on 21 September 2023. Retrieved 23 October 2019.
- ↑ "Severe Weather Facts". factsjustforkids.com. Archived from the original on 28 April 2021. Retrieved 23 October 2019.
- 1 2 Glossary of Meteorology (2009). "Severe weather". American Meteorological Society. Archived from the original on 30 September 2007. Retrieved 18 August 2009.
- ↑ IPCC, 2022: Annex II: Glossary Archived 14 March 2023 at the Wayback Machine [Möller, V., R. van Diemen, J.B.R. Matthews, C. Méndez, S. Semenov, J.S. Fuglestvedt, A. Reisinger (eds.)]. In: Climate Change 2022: Impacts, Adaptation and Vulnerability. Contribution of Working Group II to the Sixth Assessment Report of the Intergovernmental Panel on Climate Change Archived 28 February 2022 at the Wayback Machine [H.-O. Pörtner, D.C. Roberts, M. Tignor, E.S. Poloczanska, K. Mintenbeck, A. Alegría, M. Craig, S. Langsdorf, S. Löschke, V. Möller, A. Okem, B. Rama (eds.)]. Cambridge University Press, Cambridge, UK and New York, NY, USA, pp. 2897–2930, doi:10.1017/9781009325844.029.
- ↑ IPCC, 2022: Summary for Policymakers Archived 22 January 2023 at the Wayback Machine [H.-O. Pörtner, D.C. Roberts, E.S. Poloczanska, K. Mintenbeck, M. Tignor, A. Alegría, M. Craig, S. Langsdorf, S. Löschke, V. Möller, A. Okem (eds.)]. In: Climate Change 2022: Impacts, Adaptation and Vulnerability. Contribution of Working Group II to the Sixth Assessment Report of the Intergovernmental Panel on Climate Change Archived 28 February 2022 at the Wayback Machine [H.-O. Pörtner, D.C. Roberts, M. Tignor, E.S. Poloczanska, K. Mintenbeck, A. Alegría, M. Craig, S. Langsdorf, S. Löschke, V. Möller, A. Okem, B. Rama (eds.)]. Cambridge University Press, Cambridge, UK and New York, NY, USA, pp. 3–33, doi:10.1017/9781009325844.001.
- ↑ Glossary of Meteorology (2009). "Severe storm". American Meteorological Society. Archived from the original on 26 October 2005. Retrieved 4 February 2010.
- ↑ "IPCC Third Assessment Report – Climate Change 2001 – Complete online versions | GRID-Arendal – Publications – Other". Grida.no. Archived from the original on 28 September 2012. Retrieved 20 November 2013.
- 1 2 "Storm Prediction Center Frequently Asked Questions (FAQ)". Spc.noaa.gov. 16 July 2008. Archived from the original on 25 August 2009. Retrieved 5 December 2009.
- ↑ "NWS JetStream – Weather Glossary: A's". Srh.noaa.gov. 8 June 2011. Archived from the original on 24 September 2013. Retrieved 20 November 2013.
- ↑ "Why One Inch Hail Criterion?". National Weather Service. Archived from the original on 30 April 2010. Retrieved 29 May 2010.
- ↑ "Online Severe Weather Climatology – Radar Coverage Areas". Storm Prediction Center. 6 October 2007. Archived from the original on 30 May 2010. Retrieved 29 May 2010.
- 1 2 Edwards, Roger (23 March 2012). "The Online Tornado FAQ: Frequently Asked Questions about Tornadoes". Storm Prediction Center, NOAA. Archived from the original on 2 March 2012. Retrieved 29 March 2012.
- ↑ Guyer, Jared. "SPC Web Feedback – Outbreaks." Message to the author. 14 June 2007. E-mail.
- ↑ Hans Dieter Betz; Ulrich Schumann; Pierre Laroche (2009). Lightning: Principles, Instruments and Applications. Springer. pp. 202–203. ISBN 978-1-4020-9078-3. Archived from the original on 30 October 2023. Retrieved 13 May 2009.
- ↑ Derek Burch (26 April 2006). "How to Minimize Wind Damage in the South Florida Garden". University of Florida. Archived from the original on 20 June 2012. Retrieved 13 May 2009.
- ↑ T. P. Grazulis (2001). The tornado. University of Oklahoma Press. pp. 126–127. ISBN 978-0-8061-3258-7. Archived from the original on 12 August 2021. Retrieved 13 May 2009.
- ↑ Rene Munoz (10 April 2000). "Boulder's downslope winds". University Corporation for Atmospheric Research. Archived from the original on 19 March 2012. Retrieved 16 June 2009.
- ↑ National Hurricane Center (22 June 2006). "Saffir-Simpson Hurricane Scale Information". National Oceanic and Atmospheric Administration. Archived from the original on 22 June 2012. Retrieved 25 February 2007.
- ↑ Storm Prediction Center (1 February 2007). "Enhanced F Scale for Tornado Damage". Archived from the original on 11 July 2012. Retrieved 13 May 2009.
- ↑ Renno, Nilton O. (August 2008). "A thermodynamically general theory for convective vortices" (PDF). Tellus A. 60 (4): 688–99. Bibcode:2008TellA..60..688R. doi:10.1111/j.1600-0870.2008.00331.x. hdl:2027.42/73164. Archived (PDF) from the original on 9 October 2022. Retrieved 20 August 2009.
- ↑ Edwards, Roger (4 April 2006). "The Online Tornado FAQ". Storm Prediction Center. Archived from the original on 2 March 2012. Retrieved 8 September 2006.
- ↑ A tornado can pose threats to both humans and buildings. "Doppler On Wheels". Center for Severe Weather Research. 2006. Archived from the original on 5 February 2007. Retrieved 29 December 2006.
- ↑ "Tornado Warnings infographic". MCA. 18 July 2013. Archived from the original on 16 July 2013. Retrieved 18 July 2013.
- ↑ "Tornadoes". 1 August 2008. Archived from the original on 12 October 2009. Retrieved 3 August 2009.
- ↑ "AMS Glossary". Amsglossary.allenpress.com. Archived from the original on 20 June 2008. Retrieved 5 December 2009.
- ↑ "Waterspout Information – NWS Wilmington, North Carolina". Erh.noaa.gov. 14 January 2007. Archived from the original on 11 June 2011. Retrieved 5 December 2009.
- ↑ Fernando Caracena; Ronald L. Holle & Charles A. Doswell III (26 June 2002). "Microbursts: A Handbook for Visual Identification". Archived from the original on 24 November 2005. Retrieved 9 July 2008.
- ↑ Fernando Caracena (2015). "Microburst". NOAA/Forecast Systems Laboratory. Archived from the original on 19 December 2014. Retrieved 16 January 2015.
- ↑ "Oklahoma "heat burst" sends temperatures soaring". USA Today. 8 July 1999. Archived from the original on 2 February 1999. Retrieved 9 May 2007.
- 1 2 Corfidi, Stephen F.; Robert H. Johns; Jeffry S. Evans (3 December 2013). "About Derechos". Storm Prediction Center, NCEP, NWS, NOAA Web Site. Archived from the original on 20 January 2021. Retrieved 15 January 2014.
- ↑ Mogil, H. Michael (2007). Extreme Weather. New York: Black Dog & Leventhal Publisher. pp. 210–211. ISBN 978-1-57912-743-5.
- ↑ National Aeronautics and Space Administration Langley Air Force Base (June 1992). "Making the Skies Safer From Windshear". Archived from the original on 29 March 2010. Retrieved 22 October 2006.
- ↑ National Weather Service Forecast Office, Columbia, South Carolina (5 May 2010). "Downbursts". Archived from the original on 13 August 2012. Retrieved 29 March 2012.
{{cite web}}: CS1 maint: multiple names: authors list (link) - ↑ "Squall line". American Meteorological Society. 2009. Archived from the original on 17 December 2008. Retrieved 14 June 2009.
- ↑ "Prefrontal squall line". American Meteorological Society. 2009. Archived from the original on 17 August 2007. Retrieved 14 June 2009.
- ↑ "Chapter 2: Definitions" (PDF). NOAA. 2008. pp. 2–1. Archived from the original (PDF) on 6 May 2009. Retrieved 3 May 2009.
- ↑ "Bow echo". American Meteorological Society. 2009. Archived from the original on 6 June 2011. Retrieved 14 June 2009.
- ↑ Line echo wave pattern. American Meteorological Society. 2009. ISBN 978-1-878220-34-9. Archived from the original on 24 September 2008. Retrieved 3 May 2009.
- ↑ Heat burst. American Meteorological Society. 2009. ISBN 978-1-878220-34-9. Archived from the original on 6 June 2011. Retrieved 14 June 2009.
- 1 2 National Weather Forecast Office, Louisville, Kentucky (31 August 2010). "Structure and Evolution of Squall Line and Bow Echo Convective Systems". NOAA. Archived from the original on 16 November 2014. Retrieved 29 March 2012.
{{cite web}}: CS1 maint: multiple names: authors list (link) - ↑ Dan Brumbaugh (October 2004). "Hurricanes and Coral Reef Communities". BBP in Brief (3). Archived from the original on 12 August 2011. Retrieved 18 August 2009.
- ↑ "European Windstorms | PANDOWAE". Pandowae.de. Archived from the original on 11 February 2013. Retrieved 5 December 2009.
- ↑ "Adiabatic process". American Meteorological Society. 2009. Archived from the original on 17 October 2007. Retrieved 18 August 2009.
- ↑ "Nor'easters". 2006. Archived from the original on 9 October 2007. Retrieved 22 January 2008.
- ↑ "AMS Glossary". Amsglossary.allenpress.com. Archived from the original on 6 June 2011. Retrieved 5 December 2009.
- ↑ "Dust storms Factsheet – NSW Department of Health". Health.nsw.gov.au. Archived from the original on 26 November 2009. Retrieved 5 December 2009.
- ↑ "Dust Storm Safety". Nws.noaa.gov. Archived from the original on 8 March 2009. Retrieved 5 December 2009.
- ↑ Krock, Lexi (June 2002). "The World on Fire". NOVA online – Public Broadcasting System (PBS). Archived from the original on 27 October 2009. Retrieved 13 July 2009.
- ↑ "Protecting Your Home From Wildfire Damage" (PDF). Florida Alliance for Safe Homes (FLASH). p. 5. Archived from the original (PDF) on 19 July 2011. Retrieved 3 March 2010.
- ↑ Billing, 5–6
- ↑ Graham, et al.., 12
- ↑ Shea, Neil (July 2008). "Under Fire". National Geographic. Archived from the original on 15 February 2009. Retrieved 8 December 2008.
- ↑ Graham, et al.., 16.
- ↑ Graham, et al.., 9, 16.
- ↑ Billing, 5
- ↑ Westerling, Al; Hidalgo, Hg; Cayan; Swetnam, Tw (August 2006). "Warming and earlier spring increase western U.S. Forest wildfire activity". Science. 313 (5789): 940–3. Bibcode:2006Sci...313..940W. doi:10.1126/science.1128834. ISSN 0036-8075. PMID 16825536.
- ↑ "AMS Glossary". Amsglossary.allenpress.com. Archived from the original on 6 June 2011. Retrieved 5 December 2009.
- ↑ "Facts about Hailstorms". Buzzle.com. 13 July 2009. Archived from the original on 9 August 2009. Retrieved 5 December 2009.
- ↑ "Hailstorms". Andthensome.com. Archived from the original on 12 March 2009. Retrieved 5 December 2009.
- ↑ Nolan J. Doesken (April 1994). "Hail, Hail, Hail ! The Summertime Hazard of Eastern Colorado" (PDF). Colorado Climate. 17 (7). Archived from the original (PDF) on 25 November 2010. Retrieved 18 July 2009.
- ↑ "Hailstorms: Extremes". TORRO. Archived from the original on 21 February 2010. Retrieved 5 December 2009.
- ↑ Knight, C.A., and N.C. Knight, 2005: Very Large Hailstones From Aurora, Nebraska. Bull. Amer. Meteor. Soc., 86, 1773–1781.
- ↑ "Flash Flood". 2009. Archived from the original on 6 June 2011. Retrieved 9 September 2009.
- ↑ "Coastal Inundation: NOAA Watch: NOAA's All-Hazard Monitor: National Oceanic and Atmospheric Administration: U.S. Department of Commerce". Noaawatch.gov. 1 May 2006. Archived from the original on 5 November 2013. Retrieved 20 November 2013.
- ↑ Boniface J. Mills; K. Falk; J. Hansford & B. Richardson (20 January 2010). An Analysis of Heavy Rainfall Weather Systems over Louisiana. 24th Conference of Hydrology. Archived from the original on 9 June 2011. Retrieved 4 June 2010.
- ↑ WeatherEye (2007). "Flash Flood!". Sinclair Acquisition IV, Inc. Archived from the original on 27 February 2009. Retrieved 9 September 2009.
- ↑ National Weather Service Forecast Office Morristown, Tennessee (7 March 2006). "Definitions of flood and flash flood". National Weather Service Southern Region Headquarters. Archived from the original on 10 July 2017. Retrieved 9 September 2009.
- ↑ "Warden Message: Guyana Rainy Season Flood Hazards". Overseas Security Advisory Council. 5 January 2009. Archived from the original on 20 May 2020. Retrieved 5 February 2009.
- ↑ National Flood Insurance Program (2009). California's Rainy Season. Archived 1 March 2012 at the Wayback Machine U.S. Federal Emergency Management Agency (FEMA). Retrieved on 5 February 2009.
- ↑ AFP (2009). Bali Hit By Wet Season Floods. Archived 8 November 2012 at the Wayback Machine ABC News. Retrieved on 6 February 2009.
- ↑ Jack Ainsworth & Troy Alan Doss. Natural History of Fire & Flood Cycles. Archived 10 March 2012 at the Wayback Machine California Coastal Commission. Retrieved on 5 February 2009.
- ↑ FESA (2007). Flood. Archived 31 May 2009 at the Wayback Machine Government of Western Australia. Retrieved on 6 February 2009.
- ↑ King County Department of Development and Environmental Services (2009). Erosion and Sediment Control for Construction Sites. Archived 13 May 2012 at the Wayback Machine King County, Washington Government. Retrieved on 6 February 2009.
- ↑ "Preventing Disease and Injury in a Flood – Fairfax County, Virginia". Fairfaxcounty.gov. Archived from the original on 8 October 2009. Retrieved 5 December 2009.
- ↑ "Monsoon diseases: Prevention and cure". Zeenews.com. 21 July 2009. Archived from the original on 18 November 2009. Retrieved 5 December 2009.
- ↑ "australianetwork.com". ww38.australianetwork.com. Archived from the original on 29 April 2023. Retrieved 30 October 2023.
- ↑ James M. Shultz, Jill Russell and Zelde Espinel (2005). "Epidemiology of Tropical Cyclones: The Dynamics of Disaster, Disease, and Development". Epidemiologic Reviews. 27: 21–35. doi:10.1093/epirev/mxi011. PMID 15958424.
- ↑ "2005 Tropical Eastern North Pacific Hurricane Outlook". National Oceanic and Atmospheric Administration. 2005. Archived from the original on 14 June 2009. Retrieved 2 May 2006.
- ↑ Jack Williams (17 May 2005). "Background: California's tropical storms". USA Today. Archived from the original on 26 February 2009. Retrieved 7 February 2009.
- ↑ National Oceanic and Atmospheric Administration. 2005 Tropical Eastern North Pacific Hurricane Outlook. Archived 14 June 2009 at the Wayback Machine Retrieved on 2 May 2006.
- ↑ Stu Ostro (12 October 2006). "Historic snowfall for the Niagara Frontier". Weather Channel blog. Archived from the original on 20 October 2009. Retrieved 7 July 2009.
- ↑ "Historic Lake Effect Snow Storm of October 12–13, 2006". National Weather Service Forecast Office in Buffalo, New York. 21 October 2006. Archived from the original on 16 October 2015. Retrieved 8 July 2009.
- ↑ "Avalanche". American Meteorological Society. 2009. Archived from the original on 6 June 2011. Retrieved 30 June 2009.
- ↑ Gershon Fishbein (22 January 2009). "A Winter's Tale of Tragedy". Washington Post. Archived from the original on 4 June 2011. Retrieved 24 January 2009.
- ↑ Samuel C. Colbeck (March 1995). "Of Wet Snow, Slush, and Snow Balls". The Avalanche Review. 13 (5). Archived from the original on 9 September 2015. Retrieved 12 July 2009.
- ↑ "Lake-effect snow". American Meteorological Society. 2009. Archived from the original on 6 June 2011. Retrieved 15 June 2009.
- ↑ "Blizzards". Ussartf.org. Archived from the original on 9 March 2010. Retrieved 5 December 2009.
- 1 2 "AMS Glossary". Amsglossary.allenpress.com. Archived from the original on 6 June 2011. Retrieved 5 December 2009.
- ↑ "Glossary – NOAA's National Weather Service". Weather.gov. 25 June 2009. Archived from the original on 20 March 2012. Retrieved 5 December 2009.
- ↑ "WinterStorms.p65" (PDF). Archived from the original (PDF) on 25 August 2009. Retrieved 5 December 2009.
- 1 2 3 4 5 NOAA Forecast Office, Flagstaff, Arizona. "What is Meant by the Term Drought?". Archived from the original on 23 July 2011. Retrieved 29 March 2012.
{{cite web}}: CS1 maint: multiple names: authors list (link) - 1 2 3 Earth Observatory (28 August 2000). "Drought: The Creeping Disaster". Archived from the original on 19 January 2012. Retrieved 29 March 2012.
- ↑ "Billion-Dollar Weather and Climate Disasters: Table of Events | National Centers for Environmental Information (NCEI)". www.ncdc.noaa.gov. Archived from the original on 25 December 2012. Retrieved 26 December 2019.
- 1 2 Courtney, Joe; Middelmann, Miriam (2005). "Meteorological hazards" (PDF). Natural hazard risk in Perth, Western Australia – Cities Project Perth Report. Geoscience Australia. Archived (PDF) from the original on 28 July 2020. Retrieved 25 December 2012.
- 1 2 Office of Climate, Water, and Weather Services, NOAA. "Heat:A Major Killer". Archived from the original on 29 May 2012. Retrieved 30 March 2012.
{{cite web}}: CS1 maint: multiple names: authors list (link) - ↑ Australian Government Attorney-General's Department. "Heatwaves: Get the Facts". Archived from the original on 17 March 2012. Retrieved 30 March 2012.
External links
- Design Discussion Primer – Severe Storms residential building design strategies.
- Clarke, Ben; Otto, Friederike (2022). Reporting extreme weather and climate change: A guide for journalists (PDF) (Report). World Weather Attribution.