El Niño–Southern Oscillation (ENSO) is an irregular periodic variation in winds and sea surface temperatures over the tropical eastern Pacific Ocean, affecting the climate of much of the tropics and subtropics. The warming phase of the sea temperature is known as El Niño and the cooling phase as La Niña. The Southern Oscillation is the accompanying atmospheric component, coupled with the sea temperature change: El Niño is accompanied by high air surface pressure in the tropical western Pacific and La Niña with low air surface pressure there.[1][2] The two periods last several months each and typically occur every few years with varying intensity per period.[3]
The two phases relate to the Walker circulation, which was discovered by Gilbert Walker during the early twentieth century. The Walker circulation is caused by the pressure gradient force that results from a high-pressure area over the eastern Pacific Ocean, and a low-pressure system over Indonesia. Weakening or reversal of the Walker circulation (which includes the trade winds) decreases or eliminates the upwelling of cold deep sea water, thus creating El Niño by causing the ocean surface to reach above average temperatures. An especially strong Walker circulation causes La Niña, resulting in cooler ocean temperatures due to increased upwelling.
Mechanisms that cause the oscillation remain under study. The extremes of this climate pattern's oscillations cause extreme weather (such as floods and droughts) in many regions of the world. Developing countries dependent upon agriculture and fishing, particularly those bordering the Pacific Ocean, are the most affected.
In climate change science, ENSO is known as one of the internal climate variability phenomena. The other two main ones are Pacific Decadal Variability (or oscillation) and Atlantic Multi-decadal Variability (or oscillation).[4]: 23
Terminology
An early recorded mention of the term "El Niño" ("The Boy" in Spanish) to refer to climate occurred in 1892, when Captain Camilo Carrillo told the geographical society congress in Lima that Peruvian sailors named the warm south-flowing current "El Niño" because it was most noticeable around Christmas.[5] Although pre-Columbian societies were certainly aware of the phenomenon, the indigenous names for it have been lost to history.[6]
Originally, the term El Niño applied to an annual weak warm ocean current that ran southwards along the coast of Peru and Ecuador at about Christmas time.[7] However, over time the term has evolved and now refers to the warm and negative phase of the El Niño–Southern Oscillation (ENSO). La Niña ("The Girl" in Spanish) is the colder counterpart of El Niño, as part of the broader El Niño–Southern Oscillation (ENSO) climate pattern.The name La Niña originates from Spanish for "the girl", by analogy to El Niño, meaning "the boy". In the past, it was also called an anti-El Niño[8] and El Viejo, meaning "the old man."[9]
Outline
The El Niño–Southern Oscillation is a single climate phenomenon that periodically fluctuates between three phases: Neutral, La Niña or El Niño.[10] La Niña and El Niño are opposite phases which require certain changes to take place in both the ocean and the atmosphere before an event is declared.[10]
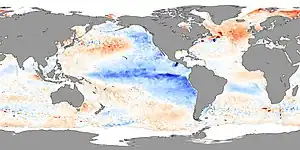
Normally the northward flowing Humboldt Current brings relatively cold water from the Southern Ocean northwards along South America's west coast to the tropics, where it is enhanced by up-welling taking place along the coast of Peru.[11][12] Along the equator, trade winds cause the ocean currents in the eastern Pacific to draw water from the deeper ocean to the surface, thus cooling the ocean surface.[12] Under the influence of the equatorial trade winds, this cold water flows westwards along the equator where it is slowly heated by the sun.[11] As a direct result sea surface temperatures in the western Pacific are generally warmer, by about 8–10 °C (14–18 °F) than those in the Eastern Pacific.[11] This warmer area of ocean is a source for convection and is associated with cloudiness and rainfall.[12] During El Niño years the cold water weakens or disappears completely as the water in the Central and Eastern Pacific becomes as warm as the Western Pacific.[11]
Walker circulation

The Walker circulation is caused by the pressure gradient force that results from a high pressure system over the eastern Pacific Ocean, and a low pressure system over Indonesia. The Walker circulations of the tropical Indian, Pacific, and Atlantic basins result in westerly surface winds in northern summer in the first basin and easterly winds in the second and third basins. As a result, the temperature structure of the three oceans display dramatic asymmetries. The equatorial Pacific and Atlantic both have cool surface temperatures in northern summer in the east, while cooler surface temperatures prevail only in the western Indian Ocean.[13] These changes in surface temperature reflect changes in the depth of the thermocline.[14]
Changes in the Walker circulation with time occur in conjunction with changes in surface temperature. Some of these changes are forced externally, such as the seasonal shift of the sun into the Northern Hemisphere in summer. Other changes appear to be the result of coupled ocean-atmosphere feedback in which, for example, easterly winds cause the sea surface temperature to fall in the east, enhancing the zonal heat contrast and hence intensifying easterly winds across the basin. These anomalous easterlies induce more equatorial upwelling and raise the thermocline in the east, amplifying the initial cooling by the southerlies. This coupled ocean-atmosphere feedback was originally proposed by Bjerknes. From an oceanographic point of view, the equatorial cold tongue is caused by easterly winds. Were the Earth climate symmetric about the equator, cross-equatorial wind would vanish, and the cold tongue would be much weaker and have a very different zonal structure than is observed today.[15]
During non-El Niño conditions, the Walker circulation is seen at the surface as easterly trade winds that move water and air warmed by the sun toward the west. This also creates ocean upwelling off the coasts of Peru and Ecuador and brings nutrient-rich cold water to the surface, increasing fishing stocks.[16] The western side of the equatorial Pacific is characterized by warm, wet, low-pressure weather as the collected moisture is dumped in the form of typhoons and thunderstorms. The ocean is some 60 cm (24 in) higher in the western Pacific as the result of this motion.[17][18][19][20]
Phases of sea surface temperature oscillation
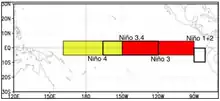
Within the National Oceanic and Atmospheric Administration in the United States, sea surface temperatures in the Niño 3.4 region, which stretches from the 120th to 170th meridians west longitude astride the equator five degrees of latitude on either side, are monitored. This region is approximately 3,000 kilometres (1,900 mi) to the southeast of Hawaii. The most recent three-month average for the area is computed, and if the region is more than 0.5 °C (0.9 °F) above (or below) normal for that period, then an El Niño (or La Niña) is considered in progress.[21] The United Kingdom's Met Office also uses a several month period to determine ENSO state.[22] When this warming or cooling occurs for only seven to nine months, it is classified as El Niño/La Niña "conditions"; when it occurs for more than that period, it is classified as El Niño/La Niña "episodes".[23]


Neutral phase

If the temperature variation from climatology is within 0.5 °C (0.9 °F), ENSO conditions are described as neutral. Neutral conditions are the transition between warm and cold phases of ENSO. Ocean temperatures (by definition), tropical precipitation, and wind patterns are near average conditions during this phase.[24] Close to half of all years are within neutral periods.[25] During the neutral ENSO phase, other climate anomalies/patterns such as the sign of the North Atlantic Oscillation or the Pacific–North American teleconnection pattern exert more influence.[26]

Warm phase
When the Walker circulation weakens or reverses and the Hadley circulation strengthens an El Niño results,[27] causing the ocean surface to be warmer than average, as upwelling of cold water occurs less or not at all offshore northwestern South America. El Niño (/ɛlˈniːnjoʊ/, /-ˈnɪn-/, Spanish pronunciation: [el ˈniɲo]) is associated with a band of warmer than average ocean water temperatures that periodically develops off the Pacific coast of South America. El niño is Spanish for "the child boy", and the capitalized term El Niño refers to the Christ child, Jesus, because periodic warming in the Pacific near South America is usually noticed around Christmas.[28] El Niño accompanies high air surface pressure in the western Pacific.[2] Mechanisms that cause the oscillation remain under study.
Cold phase
An especially strong Walker circulation causes La Niña, resulting in cooler ocean temperatures in the central and eastern tropical Pacific Ocean due to increased upwelling. La Niña (/lɑːˈniːnjə/, Spanish pronunciation: [la ˈniɲa]) is a coupled ocean-atmosphere phenomenon that is the counterpart of El Niño as part of the broader El Niño Southern Oscillation climate pattern. The name La Niña originates from Spanish, meaning "the child girl", analogous to El Niño meaning "the child boy".[29] During a period of La Niña the sea surface temperature across the equatorial eastern central Pacific will be lower than normal by 3–5 °C. In the United States, an appearance of La Niña happens for at least five months of La Niña conditions. However, each country and island nation has a different threshold for what constitutes a La Niña event, which is tailored to their specific interests.[30] The Japan Meteorological Agency for example, declares that a La Niña event has started when the average five month sea surface temperature deviation for the NINO.3 region, is over 0.5 °C (0.90 °F) cooler for 6 consecutive months or longer.[31]
Transitional phases
Transitional phases at the onset or departure of El Niño or La Niña can also be important factors on global weather by affecting teleconnections. Significant episodes, known as Trans-Niño, are measured by the Trans-Niño index (TNI).[32] Examples of affected short-time climate in North America include precipitation in the Northwest US[33] and intense tornado activity in the contiguous US.[34]
Cold phase of sea surface temperature (La Niña)
La Niña (/lə ˈniːnjə/ lə NEEN-yə, Spanish: [la ˈniɲa]; lit. 'The Girl') is an oceanic and atmospheric phenomenon that is the colder counterpart of El Niño, as part of the broader El Niño–Southern Oscillation (ENSO) climate pattern.
During a La Niña period, the sea surface temperature across the eastern equatorial part of the central Pacific Ocean will be lower than normal by 3–5 °C (5.4–9 °F). An appearance of La Niña often persists for longer than five months. El Niño and La Niña can be indicators of weather changes across the globe. Atlantic and Pacific hurricanes can have different characteristics due to lower or higher wind shear and cooler or warmer sea surface temperatures.

La Niña is a complex weather pattern that occurs every few years, as a result of variations in ocean temperatures in the equatorial band of the Pacific Ocean.[8] The phenomenon occurs as strong winds blow warm water at the ocean's surface away from South America, across the Pacific Ocean towards Indonesia.[8] As this warm water moves west, cold water from the deep sea rises to the surface near South America;[8] it is considered to be the cold phase of the broader El Niño–Southern Oscillation (ENSO) weather phenomenon, as well as the opposite of El Niño weather pattern.[8] The movement of so much heat across a quarter of the planet, and particularly in the form of temperature at the ocean surface, can have a significant effect on weather across the entire planet.
Tropical instability waves visible on sea surface temperature maps, showing a tongue of colder water, are often present during neutral or La Niña conditions.[39]
La Niña events have been observed for hundreds of years, and occurred on a regular basis during the early parts of both the 17th and 19th centuries.[40] Since the start of the 20th century, La Niña events have occurred during the following years:[41][lower-alpha 1]
Southern Oscillation
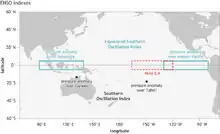

The Southern Oscillation is the atmospheric component of El Niño. This component is an oscillation in surface air pressure between the tropical eastern and the western Pacific Ocean waters. The strength of the Southern Oscillation is measured by the Southern Oscillation Index (SOI). The SOI is computed from fluctuations in the surface air pressure difference between Tahiti (in the Pacific) and Darwin, Australia (on the Indian Ocean).[42]
- El Niño episodes have negative SOI, meaning there is lower pressure over Tahiti and higher pressure in Darwin.
- La Niña episodes have positive SOI, meaning there is higher pressure in Tahiti and lower in Darwin.
Low atmospheric pressure tends to occur over warm water and high pressure occurs over cold water, in part because of deep convection over the warm water. El Niño episodes are defined as sustained warming of the central and eastern tropical Pacific Ocean, thus resulting in a decrease in the strength of the Pacific trade winds, and a reduction in rainfall over eastern and northern Australia. La Niña episodes are defined as sustained cooling of the central and eastern tropical Pacific Ocean, thus resulting in an increase in the strength of the Pacific trade winds, and the opposite effects in Australia when compared to El Niño.
Although the Southern Oscillation Index has a long station record going back to the 1800s, its reliability is limited due to the presence of both Darwin and Tahiti well south of the Equator, resulting in the surface air pressure at both locations being less directly related to ENSO.[43] To overcome this question, a new index was created, being named the Equatorial Southern Oscillation Index (EQSOI).[43][44] To generate this index data, two new regions, centered on the Equator, were delimited to create a new index: The western one is located over Indonesia and the eastern one is located over equatorial Pacific, close to the South American coast.[43] However, data on EQSOI goes back only to 1949.[43]
Related patterns
Madden–Julian oscillation

Interactions with global warming

In climate change science, ENSO is known as one of the internal climate variability phenomena. The other two main ones are Pacific Decadal Variability (or oscillation) and Atlantic Multi-decadal Variability (or oscillation).[4]: 23
El Niño events cause short-term (approximately 1 year in length) spikes in global average surface temperature while La Niña events cause short term cooling.[48] Therefore, the relative frequency of El Niño compared to La Niña events can affect global temperature trends on decadal timescales.[49] Over the last several decades, the number of El Niño events increased, and the number of La Niña events decreased,[50] although observation of ENSO for much longer is needed to detect robust changes.[51]
La Niña impacts the global climate and disrupts normal weather patterns, which can lead to intense storms in some places and droughts in others.[52]
The studies of historical data show the recent El Niño variation is most likely linked to global warming. For example, one of the most recent results, even after subtracting the positive influence of decadal variation, is shown to be possibly present in the ENSO trend,[53] the amplitude of the ENSO variability in the observed data still increases, by as much as 60% in the last 50 years.[54] A study published in 2023 by CSIRO researchers found that climate change may have increased by two times the likelihood of strong El Niño events and nine times the likelihood of strong La Niña events.[55][56] The study claims it found a consensus between different models and experiments.[57]
Future trends in ENSO are uncertain[58] as different models make different predictions.[59][60] It may be that the observed phenomenon of more frequent and stronger El Niño events occurs only in the initial phase of the global warming, and then (e.g., after the lower layers of the ocean get warmer, as well), El Niño will become weaker.[61] It may also be that the stabilizing and destabilizing forces influencing the phenomenon will eventually compensate for each other.[62] More research is needed to provide a better answer to that question. The ENSO is considered to be a potential tipping element in Earth's climate[63] and, under the global warming, can enhance or alternate regional climate extreme events through a strengthened teleconnection.[64] For example, an increase in the frequency and magnitude of El Niño events have triggered warmer than usual temperatures over the Indian Ocean, by modulating the Walker circulation.[65] This has resulted in a rapid warming of the Indian Ocean, and consequently a weakening of the Asian Monsoon.[66]
The IPCC Sixth Assessment Report summarized the state of the art of research in 2021 into the future of ENSO as follows:
- "In the long term, it is very likely that the precipitation variance related to El Niño–Southern Oscillation will increase"[4]: 113 and
- "It is very likely that rainfall variability related to changes in the strength and spatial extent of ENSO teleconnections will lead to significant changes at regional scale".[4]: 114 and
- "There is medium confidence that both ENSO amplitude and the frequency of high-magnitude events since 1950 are higher than over the period from 1850 and possibly as far back as 1400".[4]: 373
Impacts
On precipitation

Developing countries dependent upon agriculture and fishing, particularly those bordering the Pacific Ocean, are the most affected by ENSO. The effects of El Niño in South America are direct and strong. An El Niño is associated with warm and very wet weather months in April–October along the coasts of northern Peru and Ecuador, causing major flooding whenever the event is strong or extreme.[67] La Niña causes a drop in sea surface temperatures over Southeast Asia and heavy rains over Malaysia, the Philippines, and Indonesia.[68]
To the north across Alaska, La Niña events lead to drier than normal conditions, while El Niño events do not have a correlation towards dry or wet conditions. During El Niño events, increased precipitation is expected in California due to a more southerly, zonal, storm track.[69] During La Niña, increased precipitation is diverted into the Pacific Northwest due to a more northerly storm track.[70] During La Niña events, the storm track shifts far enough northward to bring wetter than normal winter conditions (in the form of increased snowfall) to the Midwestern states, as well as hot and dry summers.[71] During the El Niño portion of ENSO, increased precipitation falls along the Gulf coast and Southeast due to a stronger than normal, and more southerly, polar jet stream.[72]
In the late winter and spring during El Niño events, drier than average conditions can be expected in Hawaii.[73] On Guam during El Niño years, dry season precipitation averages below normal. However, the threat of a tropical cyclone is over triple what is normal during El Niño years, so extreme shorter duration rainfall events are possible.[74] On American Samoa during El Niño events, precipitation averages about 10 percent above normal, while La Niña events lead to precipitation amounts which average close to 10 percent below normal.[75] ENSO is linked to rainfall over Puerto Rico.[76] During an El Niño, snowfall is greater than average across the southern Rockies and Sierra Nevada mountain range, and is well-below normal across the Upper Midwest and Great Lakes states. During a La Niña, snowfall is above normal across the Pacific Northwest and western Great Lakes.[77] In Western Asia, during the region's November–April rainy season, it was discovered that in the El Niño phase there was increased precipitation, and in the La Niña phase there was a reduced amount of precipitation on average.[78][79]
Although ENSO can dramatically affect precipitation, even severe droughts and rainstorms in ENSO areas are not always deadly. Scholar Mike Davis cites ENSO as responsible for droughts in India and China in the late nineteenth century, but argues that nations in these areas avoided devastating famine during these droughts with institutional preparation and organized relief efforts.[80]
On Tehuantepecers
The synoptic condition for the Tehuantepecer, a violent mountain-gap wind in between the mountains of Mexico and Guatemala, is associated with high-pressure system forming in Sierra Madre of Mexico in the wake of an advancing cold front, which causes winds to accelerate through the Isthmus of Tehuantepec. Tehuantepecers primarily occur during the cold season months for the region in the wake of cold fronts, between October and February, with a summer maximum in July caused by the westward extension of the Azores-Bermuda high pressure system. Wind magnitude is greater during El Niño years than during La Niña years, due to the more frequent cold frontal incursions during El Niño winters.[81] Tehuantepec winds reach 20 knots (40 km/h) to 45 knots (80 km/h), and on rare occasions 100 knots (190 km/h). The wind's direction is from the north to north-northeast.[82] It leads to a localized acceleration of the trade winds in the region, and can enhance thunderstorm activity when it interacts with the Intertropical Convergence Zone.[83] The effects can last from a few hours to six days.[84]
On coral bleaching
Following the El Nino event in 1997 – 1998, the Pacific Marine Environmental Laboratory attributes the first large-scale coral bleaching event to the warming waters.[85]
On hurricanes
Based on modeled and observed accumulated cyclone energy (ACE), El Niño years usually result in less active hurricane seasons in the Atlantic Ocean, but instead favor a shift of tropical cyclone activity in the Pacific Ocean, compared to La Niña years favoring above average hurricane development in the Atlantic and less so in the Pacific basin.[86]
Regional impacts
Observations of La Niña events since 1950 show that impacts associated with La Niña events depend on what season it is.[87] However, while certain events and impacts are expected to occur during these periods, it is not certain or guaranteed that they will occur.[87]
Africa

La Niña results in wetter-than-normal conditions in southern Africa from December to February, and drier-than-normal conditions over equatorial east Africa over the same period.[89]
Asia
During La Niña years, the formation of tropical cyclones, along with the subtropical ridge position, shifts westward across the western Pacific Ocean, which increases the landfall threat in China.[90] In March 2008, La Niña caused a drop in sea surface temperatures over Southeast Asia by 2 °C (3.6 °F). It also caused heavy rains over the Philippines, Indonesia, and Malaysia.[91]
Australia
Across most of the continent, El Niño and La Niña have more impact on climate variability than any other factor. There is a strong correlation between the strength of La Niña and rainfall: the greater the sea surface temperature and Southern Oscillation difference from normal, the larger the rainfall change.[92]
Effects of the El Niño–Southern Oscillation in Australia is present across most of Australia, particularly the north and the east, and is one of the main climate drivers of the country. Associated with seasonal abnormality in many areas in the world, Australia is one of the continents most affected and experiences extensive droughts alongside considerable wet periods that cause major floods. There exist three phases — El Niño, La Niña, and Neutral, which help to account for the different states of ENSO.[93] Since 1900, there have been 28 El Niño and 19 La Niña events in Australia including the current 2023 El Niño event, which was declared on 17th of September in 2023.[94][95][96][97] The events usually last for 9 to 12 months, but some can persist for two years, though the ENSO cycle generally operates over a time period from one to eight years.[98]
Through La Niña years the eastern seaboard of Australia records above-average rainfall usually creating damaging floods due to stronger easterly trade winds from the Pacific towards Australia, thus increasing moisture in the country. Conversely, El Niño events will be associated with a weakening, or even a setback, of the prevailing trade winds, and this, results in reduced atmospheric moisture in the country.[99] Many of the worst bushfires in Australia accompany ENSO events, and can be exacerbated by a positive Indian Ocean Dipole, where they would tend to cause a warm, dry and windy climate.[100]North America

La Niña causes mostly the opposite effects of El Niño: above-average precipitation across the northern Midwest, the northern Rockies, Northern California, and the Pacific Northwest's southern and eastern regions.[101] Meanwhile, precipitation in the southwestern and southeastern states, as well as southern California, is below average.[102] This also allows for the development of many stronger-than-average hurricanes in the Atlantic and fewer in the Pacific.
The synoptic condition for Tehuantepecer winds is associated with high-pressure system forming in Sierra Madre of Mexico in the wake of an advancing cold front, which causes winds to accelerate through the Isthmus of Tehuantepec. Tehuantepecers primarily occur during the cold season months for the region in the wake of cold fronts, between October and February, with a summer maximum in July caused by the westward extension of the Azores–Bermuda high-pressure system. Wind magnitude is weaker during La Niña years than El Niño years, due to the less frequent cold frontal incursions during La Niña winters,[103] with its effects can last from a few hours to six days.[104] Between 1942 and 1957, La Niña had an impact that caused isotope changes in the plants of Baja California.[105]
In Canada, La Niña will, in general, cause a cooler, snowier winter, such as the near-record-breaking amounts of snow recorded in the La Niña winter of 2007–2008 in eastern Canada.[106][107]
In the spring of 2022, La Niña caused above-average precipitation and below-average temperatures in the state of Oregon. April was one of the wettest months on record, and La Niña effects, while less severe, were expected to continue into the summer.[108]
South America
During a time of La Niña, drought plagues the coastal regions of Peru and Chile.[109] From December to February, northern Brazil is wetter than normal.[109] La Niña causes higher than normal rainfall in the central Andes, which in turn causes catastrophic flooding on the Llanos de Mojos of Beni Department, Bolivia. Such flooding is documented from 1853, 1865, 1872, 1873, 1886, 1895, 1896, 1907, 1921, 1928, 1929 and 1931.[110]
Variations
The traditional ENSO (El Niño Southern Oscillation), also called Eastern Pacific (EP) ENSO,[111] involves temperature anomalies in the eastern Pacific. However, in the 1990s and 2000s, nontraditional ENSO conditions were observed, in which the usual place of the temperature anomaly (Niño 1 and 2) is not affected, but an anomaly arises in the central Pacific (Niño 3.4).[112] The phenomenon is called Central Pacific (CP) ENSO,[111] "dateline" ENSO (because the anomaly arises near the dateline), or ENSO "Modoki" (Modoki is Japanese for "similar, but different").[113][114] There are flavors of ENSO additional to EP and CP types and some scientists argue that ENSO exists as a continuum often with hybrid types.[115]
The effects of the CP ENSO are different from those of the traditional EP ENSO. The El Niño Modoki leads to more hurricanes more frequently making landfall in the Atlantic.[116] La Niña Modoki leads to a rainfall increase over northwestern Australia and northern Murray–Darling basin, rather than over the east as in a conventional La Niña.[117] Also, La Niña Modoki increases the frequency of cyclonic storms over Bay of Bengal, but decreases the occurrence of severe storms in the Indian Ocean.[118]
The recent discovery of ENSO Modoki has some scientists believing it to be linked to global warming.[119] However, comprehensive satellite data go back only to 1979. More research must be done to find the correlation and study past El Niño episodes. More generally, there is no scientific consensus on how/if climate change might affect ENSO.[58]
There is also a scientific debate on the very existence of this "new" ENSO. Indeed, a number of studies dispute the reality of this statistical distinction or its increasing occurrence, or both, either arguing the reliable record is too short to detect such a distinction,[120][121] finding no distinction or trend using other statistical approaches,[122][123][124][125][126] or that other types should be distinguished, such as standard and extreme ENSO.[127][128]
Following the asymmetric nature of the warm and cold phases of ENSO, some studies could not identify such distinctions for La Niña, both in observations and in the climate models,[129] but some sources indicate that there is a variation on La Niña with cooler waters on central Pacific and average or warmer water temperatures on both eastern and western Pacific, also showing eastern Pacific Ocean currents going to the opposite direction compared to the currents in traditional La Niñas.[113][114][130]
Non-traditional La Niñas

The ‘traditional’ or conventional La Niña is called an Eastern Pacific (EP) La Niña;[111] it involves temperature anomalies in the eastern Pacific. However, aside from differences in diagnostic criteria,[lower-alpha 1] non-traditional La Niñas were observed in the last two decades, in which the usual place of the temperature anomaly (Niño 1 and 2) is not affected, but rather an anomaly arises in the central Pacific (Niño 3.4).[112] The phenomenon is called Central Pacific (CP) La Niña,[111] dateline La Niña (because the anomaly arises near the dateline), or La Niña "Modoki" ("Modoki" is Japanese for "alternate / meta / similar-but-different").[131][117] These "flavors" of ENSO are in addition to EP and CP types, leading some scientists argue that ENSO is a continuum of phenomena – often with hybrid types.[132]
The effects of the CP La Niña similarly contrast with the EP La Niña – it strongly tends to increase rainfall over northwestern Australia and northern Murray–Darling basin, rather than over the east as in a conventional La Niña.[117] Also, La Niña Modoki increases the frequency of cyclonic storms over Bay of Bengal, but decreases the occurrence of severe storms in the Indian Ocean overall, with the Arabian Sea becoming severely non-conducive to tropical cyclone formation.[133][134]
Recent years when La Niña Modoki events occurred include 1973–1974, 1975–1976, 1983–1984, 1988–1989, 1998–1999, 2000–2001, 2008–2009, 2010–2011, and 2016–2017.[131][135][136]
The recent discovery of ENSO Modoki has some scientists believing it to be linked to global warming.[119] However, comprehensive satellite data go back only to 1979. Generally, there is no scientific consensus on how or if climate change may affect ENSO.[58]
There is also a scientific debate on the very existence of this "new" ENSO. A number of studies dispute the reality of this statistical distinction or its increasing occurrence, or both, either arguing the reliable record is too short to detect such a distinction,[137][138] finding no distinction or trend using other statistical approaches,[139][140][141][142][143] or that other types should be distinguished, such as standard and extreme ENSO.[144][145]
History
Different modes of ENSO-like events have been registered in paleoclimatic archives, showing different triggering methods, feedbacks and environmental responses to the geological, atmospheric and oceanographic characteristics of the time. These paleorecords can be used to provide a qualitative basis for conservation practices.[146]
| Series/ epoch | Age of archive / Location / Type of archive or proxy | Description and references |
|---|---|---|
| Mid Holocene | 4150 ya / Vanuatu Islands / Coral core | Coral bleaching in Vanuatu coral records, indication of shoaling of thermocline, is analyzed for Sr/Ca and U/Ca content, from which temperature is regressed. The temperature variability shows that during the mid-Holocene, changes in the position of the anticyclonic gyre produced average to cold (La Niña) conditions, which were probably interrupted by strong warm events (El Niño), which might have produced the bleaching, associated to decadal variability.[147] |
| Holocene | 12000ya / Bay of Guayaquil, Ecuador / Pollen content of marine core | Pollen records show changes in precipitation, possibly related to variability of the position of the ITCZ, as well as the latitudinal maxima of the Humboldt Current, which both depend on ENSO frequency and amplitude variability. Three different regimes of ENSO influence are found in the marine core.[148] |
| Holocene | 12000ya /
Pallcacocha Lake, Ecuador / Sediment core |
Core shows warm events with periodicities of 2–8 years, which become more frequent over the Holocene until about 1,200 years ago, and then decline, on top of which there are periods of low and high ENSO-related events, possibly due to changes in insolation.[149][150] |
| LGM | 45000ya / Australia / Peat core | Moisture variability in the Australian core shows dry periods related to frequent warm events (El Niño), correlated to DO events. Although no strong correlation was found with the Atlantic Ocean, it is suggested that the insolation influence probably affected both oceans, although the Pacific Ocean seems to have the most influence on teleconnection in annual, millennial and semi-precessional timescales.[151] |
| Pleistocene | 240 Kya / Indian and Pacific oceans / Coccolithophore in 9 deep sea cores | 9 deep cores in the equatorial Indian and Pacific show variations in primary productivity, related to glacial-interglacial variability and precessional periods (23 ky) related to changes in the thermocline. There is also indication that the equatorial areas can be early responders to insolation forcing.[152] |
| Pliocene | 2.8 Mya / Spain / Lacustrine laminated sediments core | The basin core shows light and dark layers, related to summer/autumn transition where more/less productivity is expected. The core shows thicker or thinner layers, with periodicities of 12, 6–7 and 2–3 years, related to ENSO, North Atlantic Oscillation (NAO) and Quasi-biennial Oscillation (QBO), and possibly also insolation variability (sunspots).[153] |
| Pliocene | 5.3 Mya / Equatorial Pacific / Foraminifera in deep sea cores | Deep sea cores at ODP site 847 and 806 show that the Pliocene warm period presented permanent El Niño-like conditions, possibly related to changes in the mean state of extratropical regions[154] or changes in ocean heat transport resulting from increased tropical cyclone activity.[155] |
| Miocene | 5.92-5.32 Mya / Italy / Evaporite varve thickness | The varve close to the Mediterranean shows 2–7 year variability, closely related to ENSO periodicity. Model simulations show that there is more correlation with ENSO than NAO, and that there is a strong teleconnection with the Mediterranean due to lower gradients of temperature.[156] |
See also
- Recharge Oscillator
- Effects of the El Niño–Southern Oscillation in Australia
- Effects of the El Niño–Southern Oscillation in the United States
For La Niña:
- 2000 Mozambique flood (attributed to La Niña)
- 2010 Pakistan floods (attributed to La Niña)
- 2010–2011 Queensland floods (attributed to La Niña)
- 2010–2012 La Niña event
- 2010–2011 Southern Africa floods (attributed to La Niña)
- 2010–2013 Southern United States and Mexico drought (attributed to La Niña)
- 2011 East Africa drought (attributed to La Niña)
- 2020 Atlantic hurricane season (unprecedented severity fueled by La Niña)
- 2021 New South Wales floods (severity fueled by La Niña)
- March 2022 Suriname flooding (attributed to La Niña)
- 2023 Auckland Anniversary Weekend floods (attributed to La Niña)
- Ocean dynamical thermostat
Footnotes
- 1 2 3 Each forecast agency has a different criteria for what constitutes a La Niña event, which is tailored to their specific interests.[30] For example, the Australian Bureau of Meteorology looks at the trade winds, SOI, weather models and sea surface temperatures in the Niño 3 and 3.4 regions before declaring that a La Niña event has started.[37] However, the Japan Meteorological Agency declares that a La Niña event has started when the average five-month sea surface temperature deviation for the NINO 3 region is more than 0.5 °C (0.90 °F) cooler for six consecutive months or longer.[38]
References
- ↑ Climate Prediction Center (2005-12-19). "Frequently Asked Questions about El Niño and La Niña". National Centers for Environmental Prediction. Archived from the original on 2009-08-27. Retrieved 2009-07-17.
- 1 2 Trenberth, K.E.; P.D. Jones; P. Ambenje; R. Bojariu; D. Easterling; A. Klein Tank; D. Parker; F. Rahimzadeh; J.A. Renwick; M. Rusticucci; B. Soden; P. Zhai. "Observations: Surface and Atmospheric Climate Change". In Solomon, S.; D. Qin; M. Manning; et al. (eds.). Climate Change 2007: The Physical Science Basis. Contribution of Working Group I to the Fourth Assessment Report of the Intergovernmental Panel on Climate Change. Cambridge, UK: Cambridge University Press. pp. 235–336.
- ↑ "El Niño, La Niña and the Southern Oscillation". MetOffice. Retrieved 2015-08-18.
- 1 2 3 4 5 IPCC, 2021: Climate Change 2021: The Physical Science Basis. Contribution of Working Group I to the Sixth Assessment Report of the Intergovernmental Panel on Climate Change [Masson-Delmotte, V., P. Zhai, A. Pirani, S.L. Connors, C. Péan, S. Berger, N. Caud, Y. Chen, L. Goldfarb, M.I. Gomis, M. Huang, K. Leitzell, E. Lonnoy, J.B.R. Matthews, T.K. Maycock, T. Waterfield, O. Yelekçi, R. Yu, and B. Zhou (eds.)]. Cambridge University Press, Cambridge, United Kingdom and New York, NY, USA, 2391 pp. doi:10.1017/9781009157896.
- ↑ Carrillo, Camilo N. (1892) "Disertación sobre las corrientes oceánicas y estudios de la correinte Peruana ó de Humboldt" (Dissertation on the ocean currents and studies of the Peruvian, or Humboldt's, current), Boletín de la Sociedad Geográfica de Lima, 2 : 72–110. [in Spanish] From p. 84: "Los marinos paiteños que navegan frecuentemente cerca de la costa y en embarcaciones pequeñas, ya al norte ó al sur de Paita, conocen esta corriente y la denomination Corriente del Niño, sin duda porque ella se hace mas visible y palpable después de la Pascua de Navidad." (The sailors [from the city of] Paita who sail often near the coast and in small boats, to the north or the south of Paita, know this current and call it "the current of the Boy [el Niño]", undoubtedly because it becomes more visible and palpable after the Christmas season.)
- ↑ "El Niño". education.nationalgeographic.org. Retrieved 2023-06-03.
- ↑ Trenberth, Kevin E (December 1997). "The Definition of El Niño". Bulletin of the American Meteorological Society. 78 (12): 2771–2777. Bibcode:1997BAMS...78.2771T. doi:10.1175/1520-0477(1997)078<2771:TDOENO>2.0.CO;2.
- 1 2 3 4 5 "What are "El Niño" and "La Niña"?". National Ocean Service. oceanservice.noaa.gov. National Oceanic and Atmospheric Administration. February 10, 2020. Retrieved 11 September 2020.
- ↑ "What is "La Niña"?". Tropical Atmosphere Ocean project / Pacific Marine Environmental Laboratory. National Oceanic and Atmospheric Administration. 24 March 2008. Retrieved 17 July 2009.
- 1 2 L'Heureux, Michelle (5 May 2014). "What is the El Niño–Southern Oscillation (ENSO) in a nutshell?". ENSO Blog. Archived from the original on 9 April 2016.
- 1 2 3 4 "El Niño, La Niña and Australia's Climate" (PDF). Australian Bureau of Meteorology. 6 May 2005. Archived (PDF) from the original on 6 January 2016.
- 1 2 3 "El Niño Southern Oscillation (ENSO)". Australian Bureau of Meteorology. 2 April 2008. Archived (PDF) from the original on 6 January 2016.
- ↑ Bureau of Meteorology. "The Walker Circulation". Commonwealth of Australia. Retrieved 2014-07-01.
- ↑ Zelle, Hein; Gerrian Appledoorn; Gerritt Burgers; Geert Jan Van Oldenborgh (2004). "Relationship Between Sea Surface Temperature and Thermocline Depth in the Eastern Equatorial Pacific". Journal of Physical Oceanography. 34 (3): 643–655. Bibcode:2004JPO....34..643Z. CiteSeerX 10.1.1.12.3536. doi:10.1175/2523.1. S2CID 16785385.
- ↑ Xie, Shang-Ping (1 February 1998). "Ocean-Atmosphere Interaction in the Making of the Walker Circulation and Equatorial Cold Tongue". Journal of Climate. 11 (2): 189–201. Bibcode:1998JCli...11..189X. doi:10.1175/1520-0442(1998)011<0189:OAIITM>2.0.CO;2. JSTOR 26242917. INIST 2154325.
- ↑ Jennings, S., Kaiser, M.J., Reynolds, J.D. (2001) "Marine Fisheries Ecology." Oxford: Blackwell Science Ltd. ISBN 0-632-05098-5
- ↑ Pidwirny, Michael (2006-02-02). "Chapter 7: Introduction to the Atmosphere". Fundamentals of Physical Geography. physicalgeography.net. Retrieved 2006-12-30.
- ↑ "Envisat watches for La Niña". BNSC via the Internet Wayback Machine. 2011-01-09. Archived from the original on 2008-04-24. Retrieved 2007-07-26.
- ↑ "The Tropical Atmosphere Ocean Array: Gathering Data to Predict El Niño". Celebrating 200 Years. NOAA. 2007-01-08. Retrieved 2007-07-26.
- ↑ "Ocean Surface Topography". Oceanography 101. JPL. 2006-07-05. Archived from the original on 2009-04-14. Retrieved 2007-07-26."Annual Sea Level Data Summary Report July 2005 – June 2006" (PDF). The Australian Baseline Sea Level Monitoring Project. Bureau of Meteorology. Archived from the original (PDF) on 2007-08-07. Retrieved 2007-07-26.
- ↑ Climate Prediction Center (2014-06-30). "ENSO: Recent Evolution, Current Status and Predictions" (PDF). National Oceanic and Atmospheric Administration. pp. 5, 19–20. Retrieved 2014-06-30.
- ↑ Met Office (2012-10-11). "El Niño, La Niña and the Southern Oscillation". United Kingdom. Retrieved 2014-06-30.
- ↑ National Climatic Data Center (June 2009). "El Niño / Southern Oscillation (ENSO) June 2009". National Oceanic and Atmospheric Administration. Retrieved 2009-07-26.
- ↑ Climate Prediction Center Internet Team (2012-04-26). "Frequently Asked Questions about El Niño and La Niña". National Oceanic and Atmospheric Administration. Retrieved 2014-06-30.
- ↑ International Research Institute for Climate and Society (February 2002). "More Technical ENSO Comment". Columbia University. Retrieved 2014-06-30.
- ↑ State Climate Office of North Carolina. "Global Patterns – El Niño-Southern Oscillation (ENSO)". North Carolina State University. Archived from the original on 2014-06-27. Retrieved 2014-06-30.
- ↑ Intergovernmental Panel on Climate Change (2007). "Climate Change 2007: Working Group I: The Physical Science Basis: 3.7 Changes in the Tropics and Subtropics, and the Monsoons". World Meteorological Organization. Archived from the original on 2014-07-14. Retrieved 2014-07-01.
- ↑ "El Niño Information". California Department of Fish and Game, Marine Region.
- ↑ Tropical Atmosphere Ocean project (2008-03-24). "What is La Niña?". Pacific Marine Environmental Laboratory. Retrieved 2009-07-17.
- 1 2 Becker, Emily (4 December 2014). "December's ENSO Update: Close, but no cigar". ENSO Blog. Archived from the original on 22 March 2016.
- ↑ "Historical El Niño and La Niña Events". Japan Meteorological Agency. Retrieved April 4, 2016.
- ↑ Trenberth, Kevin E.; Stepaniak, David P. (15 April 2001). "Indices of El Niño Evolution". Journal of Climate. 14 (8): 1697–1701. Bibcode:2001JCli...14.1697T. doi:10.1175/1520-0442(2001)014<1697:LIOENO>2.0.CO;2.
- ↑ Kennedy, Adam M.; D. C. Garen; R. W. Koch (2009). "The association between climate teleconnection indices and Upper Klamath seasonal streamflow: Trans-Niño Index". Hydrol. Process. 23 (7): 973–84. Bibcode:2009HyPr...23..973K. CiteSeerX 10.1.1.177.2614. doi:10.1002/hyp.7200. S2CID 16514830.
- ↑ Lee, Sang-Ki; R. Atlas; D. Enfield; C. Wang; H. Liu (2013). "Is there an optimal ENSO pattern that enhances large-scale atmospheric processes conducive to tornado outbreaks in the U.S?". J. Climate. 26 (5): 1626–1642. Bibcode:2013JCli...26.1626L. doi:10.1175/JCLI-D-12-00128.1.
- ↑ Cold and warm episodes by season. Climate Prediction Center (Report). National Oceanic and Atmospheric Administration. Retrieved September 11, 2020.
- ↑ La Niña – Detailed Australian analysis (Report). Australian Bureau of Meteorology. Retrieved 3 April 2016.
- ↑ "ENSO Tracker: About ENSO and the Tracker". Australian Bureau of Meteorology. Retrieved 4 April 2016.
- ↑ "Historical El Niño and La Niña Events". Japan Meteorological Agency. Retrieved 4 April 2016.
- ↑ "August 2016 ENSO update;Wavy Gravy". Climate.gov.uk. Retrieved 16 October 2021.
- ↑ Druffel, Ellen R. M.; Griffin, Sheila; Vetter, Desiree; Dunbar, Robert B.; Mucciarone, David M. (16 March 2015). "Identification of frequent La Niña events during the early 1800s in the east equatorial Pacific". Geophysical Research Letters. 42 (5): 1512–1519. Bibcode:2015GeoRL..42.1512D. doi:10.1002/2014GL062997. S2CID 129644802. Retrieved 26 February 2022.
- ↑ "Climate glossary — Southern Oscilliation Index (SOI)". Bureau of Meteorology (Australia). 2002-04-03. Retrieved 2009-12-31.
- 1 2 3 4 Barnston, Anthony (2015-01-29). "Why are there so many ENSO indexes, instead of just one?". NOAA. Retrieved 2015-08-14.
- ↑ International Research Institute for Climate and Society. "Southern Oscillation Index (SOI) and Equatorial SOI". Columbia University. Retrieved 2015-08-14.
- ↑ Madden, Roland A.; Julian, Paul R. (1971-07-01). "Detection of a 40–50 Day Oscillation in the Zonal Wind in the Tropical Pacific". Journal of the Atmospheric Sciences. 28 (5): 702–708. Bibcode:1971JAtS...28..702M. doi:10.1175/1520-0469(1971)028<0702:DOADOI>2.0.CO;2. ISSN 0022-4928.
- ↑ Zhang, Chidong (2005). "Madden-Julian Oscillation". Rev. Geophys. 43 (2): RG2003. Bibcode:2005RvGeo..43.2003Z. CiteSeerX 10.1.1.546.5531. doi:10.1029/2004RG000158. S2CID 33003839.
- ↑ "Madden-Julian oscillation forecast research". University of East Anglia. Archived from the original on 9 March 2012. Retrieved 22 February 2012.
- ↑ Brown, Patrick T.; Li, Wenhong; Xie, Shang-Ping (27 January 2015). "Regions of significant influence on unforced global mean surface air temperature variability in climate models: Origin of global temperature variability". Journal of Geophysical Research: Atmospheres. 120 (2): 480–494. doi:10.1002/2014JD022576. hdl:10161/9564.
- ↑ Trenberth, Kevin E.; Fasullo, John T. (December 2013). "An apparent hiatus in global warming?". Earth's Future. 1 (1): 19–32. Bibcode:2013EaFut...1...19T. doi:10.1002/2013EF000165.
- ↑ Trenberth, Kevin E.; Hoar, Timothy J. (January 1996). "The 1990–1995 El Niño–Southern Oscillation event: Longest on record". Geophysical Research Letters. 23 (1): 57–60. Bibcode:1996GeoRL..23...57T. CiteSeerX 10.1.1.54.3115. doi:10.1029/95GL03602.
- ↑ Wittenberg, A.T. (2009). "Are historical records sufficient to constrain ENSO simulations?". Geophys. Res. Lett. 36 (12): L12702. Bibcode:2009GeoRL..3612702W. doi:10.1029/2009GL038710. S2CID 16619392.
- ↑ "El Niño and La Niña". New Zealand: National Institute of Water and Atmospheric Research. 2007-02-27. Archived from the original on 19 March 2016. Retrieved 11 April 2016.
- ↑ Fedorov, Alexey V.; Philander, S. George (16 June 2000). "Is El Niño Changing?". Science. 288 (5473): 1997–2002. Bibcode:2000Sci...288.1997F. doi:10.1126/science.288.5473.1997. PMID 10856205. S2CID 5909976.
- ↑ Zhang, Qiong; Guan, Yue; Yang, Haijun (2008). "ENSO Amplitude Change in Observation and Coupled Models". Advances in Atmospheric Sciences. 25 (3): 331–6. Bibcode:2008AdAtS..25..361Z. CiteSeerX 10.1.1.606.9579. doi:10.1007/s00376-008-0361-5. S2CID 55670859.
- ↑ Logan, Tyne (18 May 2023). "El Niño and La Niña have become more extreme and frequent because of climate change, study finds". ABC. Retrieved 17 July 2023.
- ↑ Readfearn, Graham (18 May 2023). "Global heating has likely made El Niños and La Niñas more 'frequent and extreme', new study shows". The Guardian. Retrieved 17 July 2023.
- ↑ Cai, Wenju; Ng, Benjamin; Geng, Tao; Jia, Fan; Wu, Lixin; Wang, Guojian; Liu, Yu; Gan, Bolan; Yang, Kai; Santoso, Agus; Lin, Xiaopei; Li, Ziguang; Liu, Yi; Yang, Yun; Jin, Fei-Fei; Collins, Mat; McPhaden, Michael J. (June 2023). "Antropogenic impacts on twentieth - century ENSO variability changes". Nature Reviews Earth & Environment. 4 (6): 407–418. Bibcode:2023NRvEE...4..407C. doi:10.1038/s43017-023-00427-8. S2CID 258793531. Retrieved 17 July 2023.
- 1 2 3 Collins, M.; An, S-I; Cai, W.; Ganachaud, A.; Guilyardi, E.; Jin, F-F; Jochum, M.; Lengaigne, M.; Power, S.; Timmermann, A.; Vecchi, G.; Wittenberg, A. (2010). "The impact of global warming on the tropical Pacific Ocean and El Niño". Nature Geoscience. 3 (6): 391–7. Bibcode:2010NatGe...3..391C. doi:10.1038/ngeo868.
- ↑ Merryfield, William J. (2006). "Changes to ENSO under CO2 Doubling in a Multimodel Ensemble". Journal of Climate. 19 (16): 4009–27. Bibcode:2006JCli...19.4009M. CiteSeerX 10.1.1.403.9784. doi:10.1175/JCLI3834.1.
- ↑ Guilyardi, E.; Wittenberg, Andrew; Fedorov, Alexey; Collins, Mat; Wang, Chunzai; Capotondi, Antonietta; Van Oldenborgh, Geert Jan; Stockdale, Tim (2009). "Understanding El Nino in Ocean-Atmosphere General Circulation Models: Progress and Challenges" (PDF). Bulletin of the American Meteorological Society. 90 (3): 325–340. Bibcode:2009BAMS...90..325G. doi:10.1175/2008BAMS2387.1. hdl:10871/9288. S2CID 14866973.
- ↑ Meehl, G. A.; Teng, H.; Branstator, G. (2006). "Future changes of El Niño in two global coupled climate models". Climate Dynamics. 26 (6): 549–566. Bibcode:2006ClDy...26..549M. doi:10.1007/s00382-005-0098-0. S2CID 130825304.
- ↑ Philip, Sjoukje; van Oldenborgh, Geert Jan (June 2006). "Shifts in ENSO coupling processes under global warming". Geophysical Research Letters. 33 (11): L11704. Bibcode:2006GeoRL..3311704P. doi:10.1029/2006GL026196.
- ↑ Lenton, T. M.; Held, H.; Kriegler, E.; Hall, J. W.; Lucht, W.; Rahmstorf, S.; Schellnhuber, H. J. (12 February 2008). "Tipping elements in the Earth's climate system". Proceedings of the National Academy of Sciences. 105 (6): 1786–1793. doi:10.1073/pnas.0705414105. PMC 2538841. PMID 18258748.
- ↑ Simon Wang, S.-Y.; Huang, Wan-Ru; Hsu, Huang-Hsiung; Gillies, Robert R. (16 October 2015). "Role of the strengthened El Niño teleconnection in the May 2015 floods over the southern Great Plains". Geophysical Research Letters. 42 (19): 8140–8146. Bibcode:2015GeoRL..42.8140S. doi:10.1002/2015GL065211.
- ↑ Roxy, Mathew Koll; Ritika, Kapoor; Terray, Pascal; Masson, Sébastien (15 November 2014). "The Curious Case of Indian Ocean Warming*,+" (PDF). Journal of Climate. 27 (22): 8501–8509. Bibcode:2014JCli...27.8501R. doi:10.1175/JCLI-D-14-00471.1. S2CID 42480067.
- ↑ Roxy, Mathew Koll; Ritika, Kapoor; Terray, Pascal; Murtugudde, Raghu; Ashok, Karumuri; Goswami, B. N. (November 2015). "Drying of Indian subcontinent by rapid Indian Ocean warming and a weakening land-sea thermal gradient". Nature Communications. 6 (1): 7423. Bibcode:2015NatCo...6.7423R. doi:10.1038/ncomms8423. PMID 26077934.
- ↑ "Atmospheric Consequences of El Niño". University of Illinois. Retrieved 2010-05-31.
- ↑ Hong, Lynda (2008-03-13). "Recent heavy rain not caused by global warming". Channel NewsAsia. Retrieved 2008-06-22.
- ↑ Monteverdi, John and Jan Null. WESTERN REGION TECHNICAL ATTACHMENT NO. 97-37 NOVEMBER 21, 1997: El Niño and California Precipitation. Retrieved on 2008-02-28.
- ↑ Mantua, Nathan. La Niña Impacts in the Pacific Northwest. Archived 2007-10-22 at the Wayback Machine Retrieved on 2008-02-29.
- ↑ Reuters. La Nina could mean dry summer in Midwest and Plains. Retrieved on 2008-02-29.
- ↑ Climate Prediction Center. El Niño (ENSO) Related Rainfall Patterns Over the Tropical Pacific. Archived 2010-05-28 at the Wayback Machine Retrieved on 2008-02-28.
- ↑ Chu, Pao-Shin. Hawaii Rainfall Anomalies and El Niño. Retrieved on 2008-03-19.
- ↑ Pacific ENSO Applications Climate Center. Pacific ENSO Update: 4th Quarter, 2006. Vol. 12 No. 4. Retrieved on 2008-03-19.
- ↑ Pacific ENSO Applications Climate Center. RAINFALL VARIATIONS DURING ENSO. Archived 2008-04-21 at the Wayback Machine Retrieved on 2008-03-19.
- ↑ San Juan, Puerto Rico Weather Forecast Office (2010-09-02). "The Local Impacts of ENSO across the Northeastern Caribbean". National Weather Service Southern Region Headquarters. Retrieved 2014-07-01.
- ↑ Climate Prediction Center. ENSO Impacts on United States Winter Precipitation and Temperature. Retrieved on 2008-04-16.
- ↑ Barlow, M., H. Cullen, and B. Lyon, 2002: Drought in central and southwest Asia: La Niña, the warm pool, and Indian Ocean precipitation. J. Climate, 15, 697–700
- ↑ Nazemosadat, M. J., and A. R. Ghasemi, 2004: Quantifying the ENSO-related shifts in the intensity and probability of drought and wet periods in Iran. J. Climate, 17, 4005–4018
- ↑ Davis, Mike. "The Origins of the Third World". In The Development Reader, ed. by Stuart Corbridge and Sharad Chari, 14–29. New York: Routledge, 2008.
- ↑ Romero-Centeno, Rosario; Zavala-Hidalgo, Jorge; Gallegos, Artemio; O'Brien, James J. (1 August 2003). "Isthmus of Tehuantepec Wind Climatology and ENSO Signal". Journal of Climate. 16 (15): 2628–2639. Bibcode:2003JCli...16.2628R. doi:10.1175/1520-0442(2003)016<2628:iotwca>2.0.co;2. S2CID 53654865.
- ↑ American Meteorological Society (2012-01-26). "Tehuantepecer". Glossary of Meteorology. Retrieved 2013-05-16.
- ↑ Fett, Bob (2002-12-09). "World Wind Regimes – Central America Gap Wind Tutorial". United States Naval Research Laboratory Monterey, Marine Meteorology Division. Retrieved 2013-05-16.
- ↑ Arnerich, Paul A. "Tehuantepecer Winds of the West Coast of Mexico". Mariners Weather Log. 15 (2): 63–67.
- ↑ "FAQs | El Nino Theme Page – A comprehensive Resource". www.pmel.noaa.gov. Retrieved 12 November 2016.
- ↑ Patricola, Christina M.; Saravanan, R.; Chang, Ping (15 July 2014). "The Impact of the El Niño–Southern Oscillation and Atlantic Meridional Mode on Seasonal Atlantic Tropical Cyclone Activity". Journal of Climate. 27 (14): 5311–5328. Bibcode:2014JCli...27.5311P. doi:10.1175/JCLI-D-13-00687.1.
- 1 2 Barnston, Anthony (19 May 2014). "How ENSO leads to a cascade of global impacts". ENSO Blog. Archived from the original on 26 May 2016.
- ↑ "Slow response to East Africa famine 'cost lives'". BBC News. 18 January 2012. Retrieved 27 February 2022.
- ↑ "La Niña weather likely to last for months". Scoop News (Scoop.co.nz). 12 October 2010. Retrieved 27 February 2022.
- ↑ Wu, M. C.; Chang, W. L.; Leung, W. M. (2004). "Impacts of El Niño–Southern Oscillation events on tropical cyclone landfalling activity in the western north Pacific". Journal of Climate. 17 (6): 1419–1428. Bibcode:2004JCli...17.1419W. CiteSeerX 10.1.1.461.2391. doi:10.1175/1520-0442(2004)017<1419:ioenoe>2.0.co;2.
- ↑ Hong, Lynda (13 March 2008). "Recent heavy rain not caused by global warming". Channel News Asia. Archived from the original on 14 May 2008. Retrieved 22 June 2008.
- ↑ Power, Scott; Haylock, Malcolm; Colman, Rob; Wang, Xiangdong (1 October 2006). "The Predictability of Interdecadal Changes in ENSO Activity and ENSO Teleconnections". Journal of Climate. 19 (19): 4755–4771. Bibcode:2006JCli...19.4755P. doi:10.1175/JCLI3868.1. ISSN 0894-8755. S2CID 55572677. Retrieved 25 September 2020.
- ↑ The beasts to our east: What are El Ninos and La Ninas? By Peter Hannam from the Sydney Morning Herald, December 29, 2020.
- ↑ La Niña In Australia Bureau of Meteorology. www.bom.gov.au
- ↑ El Niño in Australia Bureau of Meteorology. www.bom.gov.au
- ↑ "Climate Driver Update". Bureau of Meteorology. Bureau of Meteorology. 17 September 2023.
- ↑ King, Andrew (13 September 2022). "La Niña, 3 years in a row: a climate scientist on what flood-weary Australians can expect this summer". The Conversation.
- ↑ What is La Nina and what does it mean for your summer? By Peter Hannam and Laura Chung. The Sydney Morning Herald. November 25, 2021.
- ↑ "Climate glossary — Southern Oscillation Index (SOI)". Bureau of Meteorology (Australia). 2002-04-03. Retrieved 2009-12-31.
- ↑ Australian Climate Extremes – Fire, BOM. Retrieved 2 May 2007.
- ↑ "La Niña is coming. Here's what that means for winter weather in the U.S." NPR. 22 October 2021. Retrieved 21 December 2021.
- ↑ "ENSO Diagnostic Discussion". Climate Prediction Center. National Oceanic and Atmospheric Administration. 5 June 2014. Archived from the original on 26 June 2014.
- ↑ Romero-Centeno, Rosario; Zavala-Hidalgo, Jorge; Gallegos, Artemio; O’Brien, James J. (August 2003). "Isthmus of Tehuantepec wind climatology and ENSO signal". Journal of Climate. 16 (15): 2628–2639. Bibcode:2003JCli...16.2628R. doi:10.1175/1520-0442(2003)016<2628:iotwca>2.0.co;2. S2CID 53654865.
- ↑ Arnerich, Paul A. "Tehuantepecer Winds of the west coast of Mexico". Mariners Weather Log. 15 (2): 63–67.
- ↑ Martínez-Ballesté, Andrea; Ezcurra, Exequiel (2018). "Reconstruction of past climatic events using oxygen isotopes in Washingtonia robusta growing in three anthropic oases in Baja California". Boletín de la Sociedad Geológica Mexicana. 70 (1): 79–94. doi:10.18268/BSGM2018v70n1a5.
- ↑ "A never-ending winter". Canada's top ten weather stories for 2008. Environment Canada. 2008-12-29. number 3. Archived from the original on 7 August 2011.
- ↑ ENSO evolution, status, and forecasts (PDF). Climate Prediction Center (Report) (update ed.). National Oceanic and Atmospheric Administration. 2005-02-28. Archived from the original (PDF) on 2005-05-15.
- ↑ "If la Niña continues, what does that mean for Oregon this summer?". 29 April 2022.
- 1 2 "La Niña follows El Niño, the GLOBE El Niño Experiment continues". Archived from the original on 15 October 2011. Retrieved 31 May 2010.
- ↑ van Valen, Gary (2013). Indigenous Agency in the Amazon. Tucson, Arizona: University of Arizona Press. p. 10.
- 1 2 3 4 Kao, Hsun-Ying; Jin-Yi Yu (2009). "Contrasting Eastern-Pacific and Central-Pacific Types of ENSO". J. Climate. 22 (3): 615–632. Bibcode:2009JCli...22..615K. CiteSeerX 10.1.1.467.457. doi:10.1175/2008JCLI2309.1.
- 1 2 Larkin, N. K.; Harrison, D. E. (2005). "On the definition of El Niño and associated seasonal average U.S. Weather anomalies". Geophysical Research Letters. 32 (13): L13705. Bibcode:2005GeoRL..3213705L. doi:10.1029/2005GL022738.
- 1 2 Yuan Yuan; HongMing Yan (2012). "Different types of La Niña events and different responses of the tropical atmosphere". Chinese Science Bulletin. 58 (3): 406–415. Bibcode:2013ChSBu..58..406Y. doi:10.1007/s11434-012-5423-5.
- 1 2 Cai, W.; Cowan, T. (17 June 2009). "La Niña Modoki impacts Australia autumn rainfall variability". Geophysical Research Letters. 36 (12): L12805. Bibcode:2009GeoRL..3612805C. doi:10.1029/2009GL037885.
- ↑ Johnson, Nathaniel C. (1 July 2013). "How Many ENSO Flavors Can We Distinguish?". Journal of Climate. 26 (13): 4816–4827. Bibcode:2013JCli...26.4816J. doi:10.1175/JCLI-D-12-00649.1. S2CID 55416945.
- ↑ Kim, Hye-Mi; Webster, Peter J.; Curry, Judith A. (3 July 2009). "Impact of Shifting Patterns of Pacific Ocean Warming on North Atlantic Tropical Cyclones". Science. 325 (5936): 77–80. Bibcode:2009Sci...325...77K. doi:10.1126/science.1174062. PMID 19574388. S2CID 13250045.
- 1 2 3 Cai, W.; Cowan, T. (2009). "La Niña Modoki impacts Australia autumn rainfall variability". Geophysical Research Letters. 36 (12): L12805. Bibcode:2009GeoRL..3612805C. doi:10.1029/2009GL037885. ISSN 0094-8276.
- ↑ M R Ramesh Kumar (2014-04-23). "El Nino, La Nina and the Indian sub-continent". Society for Environmental Communications. Retrieved 2014-07-25.
- 1 2 Yeh, Sang-Wook; Kug, Jong-Seong; Dewitte, Boris; Kwon, Min-Ho; Kirtman, Ben P.; Jin, Fei-Fei (September 2009). "El Niño in a changing climate". Nature. 461 (7263): 511–4. Bibcode:2009Natur.461..511Y. doi:10.1038/nature08316. PMID 19779449. S2CID 4423723.
- ↑ Nicholls, N. (2008). "Recent trends in the seasonal and temporal behaviour of the El Niño Southern Oscillation". Geophys. Res. Lett. 35 (19): L19703. Bibcode:2008GeoRL..3519703N. doi:10.1029/2008GL034499. S2CID 129372366.
- ↑ McPhaden, M.J.; Lee, T.; McClurg, D. (2011). "El Niño and its relationship to changing background conditions in the tropical Pacific Ocean". Geophys. Res. Lett. 38 (15): L15709. Bibcode:2011GeoRL..3815709M. doi:10.1029/2011GL048275. S2CID 9168925.
- ↑ Giese, B.S.; Ray, S. (2011). "El Niño variability in simple ocean data assimilation (SODA), 1871–2008". J. Geophys. Res. 116 (C2): C02024. Bibcode:2011JGRC..116.2024G. doi:10.1029/2010JC006695. S2CID 85504316.
- ↑ Newman, M.; Shin, S.-I.; Alexander, M.A. (2011). "Natural variation in ENSO flavors" (PDF). Geophys. Res. Lett. 38 (14): L14705. Bibcode:2011GeoRL..3814705N. doi:10.1029/2011GL047658.
- ↑ Yeh, S.-W.; Kirtman, B.P.; Kug, J.-S.; Park, W.; Latif, M. (2011). "Natural variability of the central Pacific El Niño event on multi-centennial timescales" (PDF). Geophys. Res. Lett. 38 (2): L02704. Bibcode:2011GeoRL..38.2704Y. doi:10.1029/2010GL045886.
- ↑ Hanna Na; Bong-Geun Jang; Won-Moon Choi; Kwang-Yul Kim (2011). "Statistical simulations of the future 50-year statistics of cold-tongue El Niño and warm-pool El Niño". Asia-Pacific J. Atmos. Sci. 47 (3): 223–233. Bibcode:2011APJAS..47..223N. doi:10.1007/s13143-011-0011-1. S2CID 120649138.
- ↑ L'Heureux, M.; Collins, D.; Hu, Z.-Z. (2012). "Linear trends in sea surface temperature of the tropical Pacific Ocean and implications for the El Niño-Southern Oscillation". Climate Dynamics. 40 (5–6): 1–14. Bibcode:2013ClDy...40.1223L. doi:10.1007/s00382-012-1331-2.
- ↑ Lengaigne, M.; Vecchi, G. (2010). "Contrasting the termination of moderate and extreme El Niño events in coupled general circulation models". Climate Dynamics. 35 (2–3): 299–313. Bibcode:2010ClDy...35..299L. doi:10.1007/s00382-009-0562-3. S2CID 14423113.
- ↑ Takahashi, K.; Montecinos, A.; Goubanova, K.; Dewitte, B. (2011). "ENSO regimes: Reinterpreting the canonical and Modoki El Niño" (PDF). Geophys. Res. Lett. 38 (10): L10704. Bibcode:2011GeoRL..3810704T. doi:10.1029/2011GL047364. hdl:10533/132105. S2CID 55675672.
- ↑ Kug, J.-S.; Jin, F.-F.; An, S.-I. (2009). "Two types of El Niño events: Cold Tongue El Niño and Warm Pool El Niño". J. Climate. 22 (6): 1499–1515. Bibcode:2009JCli...22.1499K. doi:10.1175/2008JCLI2624.1. S2CID 6708133.
- ↑ Shinoda, Toshiaki; Hurlburt, Harley E.; Metzger, E. Joseph (2011). "Anomalous tropical ocean circulation associated with La Niña Modoki". Journal of Geophysical Research: Oceans. 115 (12): C12001. Bibcode:2011JGRC..11612001S. doi:10.1029/2011JC007304.
- 1 2 Yuan, Yuan; Yan, HongMing (2012). "Different types of La Niña events and different responses of the tropical atmosphere". Chinese Science Bulletin. 58 (3): 406–415. Bibcode:2013ChSBu..58..406Y. doi:10.1007/s11434-012-5423-5.
- ↑ Johnson, Nathaniel C. (2013). "How many ENSO flavors can we distinguish?". Journal of Climate. 26 (13): 4816–27. Bibcode:2013JCli...26.4816J. doi:10.1175/JCLI-D-12-00649.1.
- ↑ Kumar, M. R. Ramesh (23 April 2014). El Nino, La Niña and the Indian sub-continent (Report). Society for Environmental Communications. Retrieved 25 July 2014.
- ↑ Sumesh, K.G.; Kumar, M. R. Ramesh (10 March 2014). "Tropical cyclones over NIO during La Niña Modoki years" (PDF). Indian Journal of Geo-Marine Sciences. Retrieved 18 February 2017.
- ↑ Tedeschi, Renata G.; Cavalcanti, Iracema F. A. (23 April 2014). "Influência dos ENOS Canônico e Modoki na precipitação da América do Sul" (PDF) (in Portuguese). Instituto Nacional de Pesquisas Espaciais/Centro de Previsão de Tempo e Estudos Climáticos. Archived from the original (PDF) on 23 October 2014. Retrieved 27 September 2014.
- ↑ Nicholls, N. (2008). "Recent trends in the seasonal and temporal behaviour of the El Niño Southern Oscillation". Geophysical Research Letters. 35 (19): L19703. Bibcode:2008GeoRL..3519703N. doi:10.1029/2008GL034499. S2CID 129372366.
- ↑ McPhaden, M.J.; Lee, T.; McClurg, D. (2011). "El Niño and its relationship to changing background conditions in the tropical Pacific Ocean". Geophysical Research Letters. 38 (15): L15709. Bibcode:2011GeoRL..3815709M. doi:10.1029/2011GL048275. S2CID 9168925.
- ↑ Giese, B.S.; Ray, S. (2011). "El Niño variability in simple ocean data assimilation (SODA), 1871–2008". J. Geophys. Res. 116 (C2): C02024. Bibcode:2011JGRC..116.2024G. doi:10.1029/2010JC006695. S2CID 85504316.
- ↑ Newman, M.; Shin, S.-I.; Alexander, M. A. (2011). "Natural variation in ENSO flavors". Geophysical Research Letters. 38 (14): L14705. Bibcode:2011GeoRL..3814705N. doi:10.1029/2011GL047658.
- ↑ Yeh, S.-W.; Kirtman, B. P.; Kug, J.-S.; Park, W.; Latif, M. (2011). "Natural variability of the central Pacific El Niño event on multi-centennial timescales" (PDF). Geophysical Research Letters. 38 (2): L02704. Bibcode:2011GeoRL..38.2704Y. doi:10.1029/2010GL045886.
- ↑ Na, Hanna; Jang, Bong-Geun; Choi, Won-Moon; Kim, Kwang-Yul (2011). "Statistical simulations of the future 50 year statistics of cold-tongue El Niño and warm-pool El Niño". Asia-Pacific J. Atmos. Sci. 47 (3): 223–233. Bibcode:2011APJAS..47..223N. doi:10.1007/s13143-011-0011-1. S2CID 120649138.
- ↑ L'Heureux, M.; Collins, D.; Hu, Z.-Z. (2012). "Linear trends in sea surface temperature of the tropical Pacific Ocean and implications for the El Niño-Southern Oscillation". Climate Dynamics. 40 (5–6): 1–14. Bibcode:2013ClDy...40.1223L. doi:10.1007/s00382-012-1331-2.
- ↑ Lengaigne, M.; Vecchi, G. (2010). "Contrasting the termination of moderate and extreme El Niño events in coupled general circulation models". Climate Dynamics. 35 (2–3): 299–313. Bibcode:2010ClDy...35..299L. doi:10.1007/s00382-009-0562-3. S2CID 14423113.
- ↑ Takahashi, K.; Montecinos, A.; Goubanova, K.; Dewitte, B. (2011). "ENSO regimes: Reinterpreting the canonical and Modoki El Niño". Geophysical Research Letters. 38 (10): L10704. Bibcode:2011GeoRL..3810704T. doi:10.1029/2011GL047364. hdl:10533/132105. S2CID 55675672.
- ↑ Willis, Katherine J; Araújo, Miguel B; Bennett, Keith D; Figueroa-Rangel, Blanca; Froyd, Cynthia A; Myers, Norman (28 February 2007). "How can a knowledge of the past help to conserve the future? Biodiversity conservation and the relevance of long-term ecological studies". Philosophical Transactions of the Royal Society B: Biological Sciences. 362 (1478): 175–187. doi:10.1098/rstb.2006.1977. PMC 2311423. PMID 17255027.
- ↑ Corrège, Thierry; Delcroix, Thierry; Récy, Jacques; Beck, Warren; Cabioch, Guy; Le Cornec, Florence (August 2000). "Evidence for stronger El Niño-Southern Oscillation (ENSO) Events in a Mid-Holocene massive coral". Paleoceanography. 15 (4): 465–470. Bibcode:2000PalOc..15..465C. doi:10.1029/1999pa000409.
- ↑ Seillès, Brice; Sánchez Goñi, Maria Fernanda; Ledru, Marie-Pierre; Urrego, Dunia H; Martinez, Philippe; Hanquiez, Vincent; Schneider, Ralph (April 2016). "Holocene land–sea climatic links on the equatorial Pacific coast (Bay of Guayaquil, Ecuador)". The Holocene. 26 (4): 567–577. Bibcode:2016Holoc..26..567S. doi:10.1177/0959683615612566. hdl:10871/18307. S2CID 130306658.
- ↑ Rodbell, Donald T.; Seltzer, Geoffrey O.; Anderson, David M.; Abbott, Mark B.; Enfield, David B.; Newman, Jeremy H. (22 January 1999). "An ~15,000-Year Record of El Niño-Driven Alluviation in Southwestern Ecuador". Science. 283 (5401): 516–520. Bibcode:1999Sci...283..516R. doi:10.1126/science.283.5401.516. PMID 9915694. S2CID 13714632.
- ↑ Moy, Christopher M.; Seltzer, Geoffrey O.; Rodbell, Donald T.; Anderson, David M. (2002). "Variability of El Niño/Southern Oscillation activity at millennial timescales during the Holocene epoch". Nature. 420 (6912): 162–165. Bibcode:2002Natur.420..162M. doi:10.1038/nature01194. PMID 12432388. S2CID 4395030.
- ↑ Turney, Chris S. M.; Kershaw, A. Peter; Clemens, Steven C.; Branch, Nick; Moss, Patrick T.; Fifield, L. Keith (2004). "Millennial and orbital variations of El Niño/Southern Oscillation and high-latitude climate in the last glacial period". Nature. 428 (6980): 306–310. Bibcode:2004Natur.428..306T. doi:10.1038/nature02386. PMID 15029193. S2CID 4303100.
- ↑ Beaufort, Luc; Garidel-Thoron, Thibault de; Mix, Alan C.; Pisias, Nicklas G. (28 September 2001). "ENSO-like Forcing on Oceanic Primary Production During the Late Pleistocene". Science. 293 (5539): 2440–2444. Bibcode:2001Sci...293.2440B. doi:10.1126/science.293.5539.2440. PMID 11577233.
- ↑ Muñoz, Arsenio; Ojeda, Jorge; Sánchez-Valverde, Belén (2002). "Sunspot-like and ENSO/NAO-like periodicities in lacustrinelaminated sediments of the Pliocene Villarroya Basin (La Rioja,Spain)". Journal of Paleolimnology. 27 (4): 453–463. Bibcode:2002JPall..27..453M. doi:10.1023/a:1020319923164. S2CID 127610981.
- ↑ Wara, Michael W.; Ravelo, Ana Christina; Delaney, Margaret L. (29 July 2005). "Permanent El Niño-Like Conditions During the Pliocene Warm Period". Science. 309 (5735): 758–761. Bibcode:2005Sci...309..758W. CiteSeerX 10.1.1.400.7297. doi:10.1126/science.1112596. PMID 15976271. S2CID 37042990.
- ↑ Fedorov, Alexey V.; Brierley, Christopher M.; Emanuel, Kerry (February 2010). "Tropical cyclones and permanent El Niño in the early Pliocene epoch". Nature. 463 (7284): 1066–1070. Bibcode:2010Natur.463.1066F. doi:10.1038/nature08831. hdl:1721.1/63099. PMID 20182509. S2CID 4330367.
- ↑ Galeotti, Simone; von der Heydt, Anna; Huber, Matthew; Bice, David; Dijkstra, Henk; Jilbert, Tom; Lanci, Luca; Reichart, Gert-Jan (May 2010). "Evidence for active El Niño Southern Oscillation variability in the Late Miocene greenhouse climate". Geology. 38 (5): 419–422. Bibcode:2010Geo....38..419G. doi:10.1130/g30629.1. S2CID 140682002.
External links
- Current map of sea surface temperature anomalies in the Pacific Ocean
- Southern Oscillation Diagnostic Discussion at CPC
- "Current map of sea surface temperature anomalies in the Pacific Ocean". earth.nullschool.net.
- "Southern Oscillation diagnostic discussion". Climate Prediction Center (CPC). National Oceanic and Atmospheric Administration.
- "ENSO Outlook – An alert system for the El Niño–Southern Oscillation". Australian Bureau of Meteorology.