| Washington's 4th congressional district | |||
|---|---|---|---|
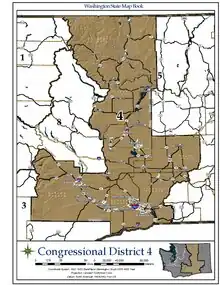
Interactive map of district boundaries since January 3, 2023. Points indicate major cities in the district (Yakima, the Tri-Cities (Kennewick, Pasco, and Richland), and Moses Lake respectively). | |||
| Representative |
| ||
| Population (2022) | 783,190 | ||
| Median household income | $73,355[1] | ||
| Ethnicity |
| ||
| Cook PVI | R+11[2] | ||
Washington's 4th congressional district encompasses a large area of central Washington, covering the counties of Douglas, Okanogan, Grant, Yakima, Benton, and Klickitat; and parts of Adams and Franklin counties. The district is dominated by the Yakima and Tri-Cities areas. With a Cook Partisan Voting Index rating of R+11, it is the most Republican district in Washington.[2]
Its Republican dominance is long-established. Apart from Klickitat County, which was won six times by Democrats between 1968 and 2008 — though never with more than 51 percent of the ballots — no Democratic presidential candidate has carried any county in the district since Bill Clinton in 1992 carried Okanogan County. None of the other counties in the district have backed a Democrat for President since Lyndon B. Johnson in 1964, while Adams County has not voted Democratic since Franklin D. Roosevelt in 1936.
George W. Bush carried the district in 2000 and 2004 with 62% and 63% of the vote, respectively. The 4th district also gave John McCain 58% of the vote in 2008, his strongest showing in Washington.
Only three Democrats have ever represented the district in Congress. The last Democrat to represent the district was Jay Inslee, who held the seat during the 103rd Congress. Doc Hastings, Inslee's Republican opponent in 1992, defeated Inslee in a 1994 rematch and served in Congress until he retired in 2014. After losing to Hastings in 1994, Inslee later moved to Bainbridge Island and was sent back to Congress representing the first district in the central Puget Sound area. Inslee was elected the state's governor in 2012, and took office in January 2013. In the 2008 election, Hastings easily defeated challenger George Fearing. The 4th district has been represented in the U.S. House of Representatives by Dan Newhouse since 2015, a Republican from Sunnyside.
Results from presidential elections
| Year | Winner & margin |
|---|---|
| 1952 | Eisenhower (R) 62 – 38% |
| 1956 | Eisenhower (R) 58 – 42% |
| 1960 | Nixon (R) 56 – 44% |
| 1964 | Johnson (D) 58 – 42% |
| 1968 | Nixon (R) 53 – 39% |
| 1972 | Nixon (R) 59 – 41% |
| 1976 | Ford (R) 52 – 44% |
| 1980 | Reagan (R) 55 – 36% |
| 1984 | Reagan (R) 63 – 34% |
| 1988 | Bush (R) 57 – 41% |
| 1992 | Bush (R) 42 – 35% |
| 1996 | Dole (R) 48 – 40% |
| 2000 | Bush (R) 62 – 34% |
| 2004 | Bush (R) 63 – 35% |
| 2008 | McCain (R) 58 – 40% |
| 2012 | Romney (R) 60 – 38% |
| 2016 | Trump (R) 56 – 34% |
| 2020 | Trump (R) 58 – 39% |
List of members representing the district
Recent election results
2012
| Party | Candidate | Votes | % | |
|---|---|---|---|---|
| Republican | Doc Hastings (Incumbent) | 154,749 | 66.2 | |
| Democratic | Mary Baechler | 78,940 | 33.8 | |
| Total votes | 233,689 | 100.0 | ||
2014
| Party | Candidate | Votes | % | |
|---|---|---|---|---|
| Republican | Dan Newhouse | 77,772 | 50.8 | |
| Republican | Clint Didier | 75,307 | 49.2 | |
| Total votes | 153,079 | 100.0 | ||
| Republican hold | ||||
2016
| Party | Candidate | Votes | % | |
|---|---|---|---|---|
| Republican | Dan Newhouse (incumbent) | 132,517 | 57.6 | |
| Republican | Clint Didier | 97,402 | 42.4 | |
| Total votes | 229,919 | 100.0 | ||
| Republican hold | ||||
2018
| Party | Candidate | Votes | % | |
|---|---|---|---|---|
| Republican | Dan Newhouse (incumbent) | 141,551 | 62.8 | |
| Democratic | Christine Brown | 83,785 | 37.2 | |
| Total votes | 225,336 | 100.0 | ||
| Republican hold | ||||
2020
| Party | Candidate | Votes | % | |
|---|---|---|---|---|
| Republican | Dan Newhouse (incumbent) | 202,108 | 66.2 | |
| Democratic | Douglas McKinley | 102,667 | 33.6 | |
| Write-in | 488 | 0.2 | ||
| Total votes | 305,263 | 100 | ||
| Republican hold | ||||
2022
}
| Party | Candidate | Votes | % | |
|---|---|---|---|---|
| Republican | Dan Newhouse (incumbent) | 150,619 | 66.5 | |
| Democratic | Doug White | 70,710 | 31.2 | |
| Write-in | 5,318 | 2.3 | ||
| Total votes | 226,647 | 100 | ||
| Republican hold | ||||
Historical district boundaries


See also
References
- ↑ "My Congressional District".
- 1 2 "2022 Cook PVI: District Map and List". Cook Political Report. Retrieved January 10, 2023.
- ↑ "Federal - All Results". Washington Secretary of State. Retrieved November 27, 2012.
- ↑ "Federal - All Results". Washington Secretary of State. November 4, 2014. Retrieved December 8, 2014.
- ↑ "November 8, 2016 General Election Results". Washington Secretary of State. Retrieved December 3, 2016.
- ↑ Johnson, Cheryl L. (February 28, 2019). "Statistics of the Congressional Election of November 6, 2018". Clerk of the U.S. House of Representatives. Retrieved April 27, 2019.
- ↑ "November 3, 2020 General Election Results". Washington Secretary of State. Retrieved December 4, 2020.
- Martis, Kenneth C. (1989). The Historical Atlas of Political Parties in the United States Congress. New York: Macmillan Publishing Company.
- Martis, Kenneth C. (1982). The Historical Atlas of United States Congressional Districts. New York: Macmillan Publishing Company.
- Congressional Biographical Directory of the United States 1774–present; accessed November 8, 2014.
.jpg.webp)


.tif.png.webp)

_(new_version).svg.png.webp)