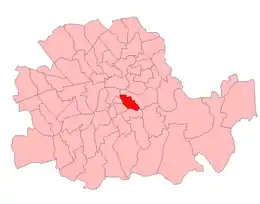
| Bermondsey West | |
|---|---|
| Former Borough constituency for the House of Commons | |
| 1918–1950 | |
| Seats | one |
| Created from | Bermondsey and Rotherhithe |
| Replaced by | Bermondsey |
Bermondsey West was a parliamentary constituency centred on the Bermondsey district of South London. It returned one Member of Parliament (MP) to the House of Commons of the Parliament of the United Kingdom.
The constituency was created for the 1918 general election and abolished for the 1950 general election.
Boundaries


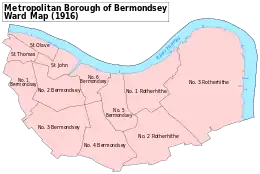
The constituency, when it was created in 1918, comprised the wards numbered One, Two, Three and Four of the Metropolitan Borough of Bermondsey, in the County of London. This was the south-western part of the borough, and was similar in extent to the preceding Bermondsey Division of the parliamentary borough of Southwark.
It covered South Bermondsey ward and most of London Bridge & West Bermondsey ward, together with small sections of North Bermondsey, Chaucer and Old Kent Road wards, in the modern day London Borough of Southwark.
Members of Parliament
| Election | Member | Party | |
|---|---|---|---|
| 1918 | Harold Glanville | Liberal | |
| 1922 | Alfred Salter | Labour | |
| 1923 | Roderick Kedward | Liberal | |
| 1924 | Alfred Salter | Labour | |
| 1945 | Richard Sargood | ||
| 1950 | constituency abolished | ||
Election results
Election in the 1910s

| Party | Candidate | Votes | % | ±% | |
|---|---|---|---|---|---|
| Liberal | Harold Glanville | 4,260 | 40.6 | ||
| National Liberal | Charles Richard Scriven* | 2,998 | 28.5 | ||
| Labour | Alfred Salter | 1,956 | 18.6 | ||
| NFDDSS | Harry Becker | 1,294 | 12.3 | ||
| Majority | 1,262 | 12.1 | |||
| Turnout | 23,100 | 45.5 | |||
| Liberal win (new seat) | |||||
*endorsed by Coalition Government
Election in the 1920s
| Party | Candidate | Votes | % | ±% | |
|---|---|---|---|---|---|
| Labour | Alfred Salter | 7,550 | 44.6 | +26.0 | |
| Liberal | Roderick Kedward | 5,225 | 30.9 | -9.7 | |
| National Liberal | Charles Richard Scriven | 2,814 | 16.6 | -11.9 | |
| Ind. Unionist | Charles Louis Nordon | 1,328 | 7.9 | New | |
| Majority | 2,325 | 13.7 | N/A | ||
| Turnout | 26,168 | 64.6 | +19.1 | ||
| Labour gain from Liberal | Swing | +17.9 | |||
| Party | Candidate | Votes | % | ±% | |
|---|---|---|---|---|---|
| Liberal | Roderick Kedward | 9,186 | 52.5 | +21.6 | |
| Labour | Alfred Salter | 8,298 | 47.5 | +2.9 | |
| Majority | 888 | 5.0 | N/A | ||
| Turnout | 26,456 | 66.1 | +1.5 | ||
| Liberal gain from Labour | Swing | +9.4 | |||
| Party | Candidate | Votes | % | ±% | |
|---|---|---|---|---|---|
| Labour | Alfred Salter | 11,578 | 57.2 | +9.7 | |
| Liberal | Roderick Kedward | 8,676 | 42.8 | -9.7 | |
| Majority | 2,902 | 14.4 | N/A | ||
| Turnout | 26,989 | 75.0 | +8.9 | ||
| Labour gain from Liberal | Swing | +9.7 | |||
| Party | Candidate | Votes | % | ±% | |
|---|---|---|---|---|---|
| Labour | Alfred Salter | 13,231 | 60.2 | +3.0 | |
| Liberal | Leonard Stein | 4,865 | 22.2 | -20.6 | |
| Unionist | Herbert Cecil Butcher | 3,852 | 17.6 | New | |
| Majority | 8,366 | 38.0 | +23.6 | ||
| Turnout | 32,963 | 66.6 | -8.4 | ||
| Labour hold | Swing | +11.8 | |||
Election in the 1930s
| Party | Candidate | Votes | % | ±% | |
|---|---|---|---|---|---|
| Labour | Alfred Salter | 10,039 | 48.1 | -12.1 | |
| Conservative | Norman Bower | 9,948 | 47.7 | +30.1 | |
| Communist | Wal Hannington | 873 | 4.2 | New | |
| Majority | 91 | 0.4 | -37.6 | ||
| Turnout | 32,904 | 63.4 | -3.2 | ||
| Labour hold | Swing | -21.6 | |||
| Party | Candidate | Votes | % | ±% | |
|---|---|---|---|---|---|
| Labour | Alfred Salter | 12,603 | 62.2 | +14.1 | |
| National Liberal | Francis Rainault Abbott Glanville | 7,674 | 37.8 | -9.9 | |
| Majority | 4,929 | 24.4 | +24.0 | ||
| Turnout | 30,803 | 65.8 | +2.4 | ||
| Labour hold | Swing | N/A | |||
- Glanville was a son of the former MP Harold Glanville. Conservative candidate Francis Howard Collier withdrew when Glanville gave an undertaking to support the National Government.[1]
Election in the 1940s
| Party | Candidate | Votes | % | ±% | |
|---|---|---|---|---|---|
| Labour | Richard Sargood | 8,139 | 72.2 | +10.0 | |
| National Liberal | W. Bernard Pemberton | 2,238 | 19.8 | -18.0 | |
| Liberal | Francis Howard Collier | 903 | 8.0 | New | |
| Majority | 5,901 | 52.4 | +28.0 | ||
| Turnout | 17,004 | 66.3 | +0.5 | ||
| Labour hold | Swing | +14.0 | |||
References
- ↑ The Times House of Commons, 1935
- Boundaries of Parliamentary Constituencies 1885-1972, compiled and edited by F.W.S. Craig (Parliamentary Reference Publications 1972)
- Leigh Rayment's Historical List of MPs – Constituencies beginning with "B" (part 2)