| |||||||||||||||||||||||||||||||
All 51 seats in the Western Australian Legislative Assembly and 15 (of the 30) seats to the Western Australian Legislative Council 26 Assembly seats were needed for a majority | |||||||||||||||||||||||||||||||
|---|---|---|---|---|---|---|---|---|---|---|---|---|---|---|---|---|---|---|---|---|---|---|---|---|---|---|---|---|---|---|---|
| |||||||||||||||||||||||||||||||
| |||||||||||||||||||||||||||||||
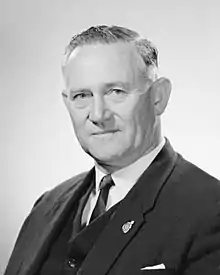
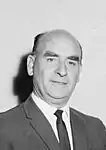
Elections were held in the state of Western Australia on 23 March 1968 to elect all 51 members to the Legislative Assembly and 15 members to the 30-seat Legislative Council. The Liberal-Country coalition government, led by Premier Sir David Brand, won a record fourth term in office against the Labor Party, led by Opposition Leader John Tonkin.
Results
Legislative Assembly
|
Western Australian state election, 23 March 1968 | ||||||
|---|---|---|---|---|---|---|
| Enrolled voters | 359,790[1] | |||||
| Votes cast | 331,325 | Turnout | 92.09% | –0.24% | ||
| Informal votes | 10,255 | Informal | 3.10% | –0.01% | ||
| Summary of votes by party | ||||||
| Party | Primary votes | % | Swing | Seats | Change | |
| Labor | 145,605 | 45.35% | +2.71% | 23 | + 2 | |
| Liberal and Country | 141,271 | 44.00% | –4.54% | 19 | – 2 | |
| Country | 16,879 | 5.25% | +0.38% | 9 | + 1 | |
| Democratic Labor | 10,456 | 3.26% | +2.32% | 0 | ± 0 | |
| Democratic | 2,216 | 0.69% | +0.69% | 0 | ± 0 | |
| Communist | 1,694 | 0.53% | +0.44% | 0 | ± 0 | |
| Independent | 2,949 | 0.92% | –1.98% | 0 | ± 0 | |
| Total | 321,070 | 51 | ||||
- 1 449,122 electors were enrolled to vote at the election, but 14 seats (27.45% of the total) were uncontested—five Liberal seats representing 32,810 enrolled voters, five Country seats representing 29,746 enrolled voters, and four Labor seats representing 26,776 enrolled voters.
Legislative Council
|
Western Australian state election, 23 March 1968 | ||||||
|---|---|---|---|---|---|---|
| Enrolled voters | 208,417[1] | |||||
| Votes cast | 192,342 | Turnout | 92.29% | +0.15% | ||
| Informal votes | 8,631 | Informal | 4.49% | +0.22% | ||
| Summary of votes by party | ||||||
| Party | Primary votes | % | Swing | Seats | Change | |
| Labor | 85,674 | 46.64% | 6 | 10 | ||
| Liberal and Country | 67,977 | 37.00% | 4 | 12 | ||
| Country | 21,228 | 11.56% | 5 | 8 | ||
| Democratic Labor | 4,502 | 2.45% | 0 | 0 | ||
| Independent | 4,330 | 2.36% | 0 | 0 | ||
| Total | 183,711 | 15 | 30 | |||
- 1 449,122 electors were enrolled to vote at the election, but 9 seats (60% of the total) were uncontested—three Liberal seats representing 99,137 enrolled voters, three Country seats representing 53,847 enrolled voters, and three Labor seats representing 86,198 enrolled voters.
Post-election pendulum
| LCL/Country seats (28) | |||
| Marginal | |||
| Subiaco | Hugh Guthrie | LCL | 0.4% |
| Kimberley | Alan Ridge | LCL | 2.2% |
| Moore | Edgar Lewis | CP | 2.3% v IND |
| Mirrabooka | Doug Cash | LCL | 2.8% |
| Merredin-Yilgarn | Jack Stewart | LCL | 2.9% |
| Murray | Ewart Runciman | LCL | 3.8% |
| Blackwood | Ron Kitney | CP | 4.6% v LCL |
| Toodyay | James Craig | CP | 4.7% |
| Bunbury | Maurice Williams | LCL | 5.7% |
| Fairly safe | |||
| Roe | Bill Young | CP | 9.7% v LCL |
| Safe | |||
| Cottesloe | Ross Hutchinson | LCL | 10.0% |
| Mount Lawley | Ray O'Connor | LCL | 10.0% |
| Floreat | Andrew Mensaros | LCL | 14.6% |
| Dale | Cyril Rushton | LCL | 15.4% |
| Darling Range | Ken Dunn | LCL | 16.2% |
| Nedlands | Charles Court | LCL | 26.6% |
| South Perth | Bill Grayden | LCL | 28.6% v DLP |
| East Melville | Des O'Neil | LCL | 30.3% v COM |
| Avon | Harry Gayfer | CP | unopp. |
| Greenough | David Brand | LCL | unopp. |
| Katanning | Crawford Nalder | CP | unopp. |
| Mount Marshall | Ray McPharlin | CP | unopp. |
| Murchison-Eyre | Richard Burt | LCL | unopp. |
| Narrogin | William Manning | CP | unopp. |
| Stirling | Clayton Mitchell | CP | unopp. |
| Vasse | Stewart Bovell | LCL | unopp. |
| Wellington | Iven Manning | LCL | unopp. |
| Wembley | Guy Henn | LCL | unopp. |
| Labor seats (23) | |||
| Marginal | |||
| Canning | Tom Bateman | ALP | 0.5% |
| Clontarf | Donald May | ALP | 2.2% |
| Maylands | John Harman | ALP | 3.0% |
| Northam | Ken McIver | ALP | 3.6% |
| Mount Hawthorn | Ron Bertram | ALP | 4.2% |
| Karrinyup | Stan Lapham | ALP | 4.3% |
| Albany | Jack Hall | ALP | 5.4% |
| Fairly safe | |||
| Geraldton | Bill Sewell | ALP | 6.2% |
| Perth | Terry Burke | ALP | 6.2% |
| Collie | Tom Jones | ALP | 6.6% |
| Warren | David Evans | ALP | 8.8% |
| Safe | |||
| Ascot | Merv Toms | ALP | 13.2% |
| Balcatta | Herb Graham | ALP | 13.4% |
| Gascoyne | Daniel Norton | ALP | 14.1% |
| Belmont | Colin Jamieson | ALP | 14.5% |
| Melville | John Tonkin | ALP | 17.5% |
| Cockburn | Don Taylor | ALP | 18.6% |
| Swan | Bill Haigh | ALP | 21.0% |
| Fremantle | Harry Fletcher | ALP | 23.5% v DLP |
| Boulder-Dundas | Arthur Moir | ALP | unopp. |
| Kalgoorlie | Tom Evans | ALP | unopp. |
| Pilbara | Arthur Bickerton | ALP | unopp. |
| Victoria Park | Ron Davies | ALP | unopp. |
See also
References
| General elections | |
|---|---|
| Legislative Council elections | |
| Local elections |
|
| Referendums | |
See also: List of state by-elections | |
This article is issued from Wikipedia. The text is licensed under Creative Commons - Attribution - Sharealike. Additional terms may apply for the media files.