| ||||||||||||||||||||||||||
| ||||||||||||||||||||||||||
 County Results
| ||||||||||||||||||||||||||
| ||||||||||||||||||||||||||
.jpg.webp)
_(3x4-1).jpg.webp)
| Elections in New Mexico |
|---|
 |
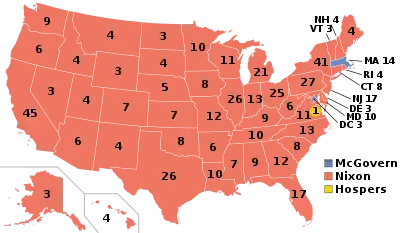
The 1972 United States presidential election in New Mexico took place on November 7, 1972. This was the fifteenth Presidential Election which New Mexico participated in. All fifty states plus The District of Columbia, were part of this presidential election. State voters chose four electors to represent them in the Electoral College, who voted for the President and Vice President. South Dakota Senator George McGovern was nominated to run against Nixon, and was defeated in one of the most lopsided elections in United States history. McGovern lost every state except Massachusetts to Nixon.[1]
New Mexico was won by President Richard Nixon by a 24-point landslide, mirroring the national popular vote margin by a near-perfect amount and making New Mexico 1.3% more Republican than the nation-at-large. McGovern won only two counties: he comfortably won Rio Arriba County by 12.6 percentage points, and also won San Miguel County by 2.5 percentage points.[2] Nixon was the first Republican to carry Grant County since 1928.
The 1972 election remains the last when Santa Fe, Taos or Mora Counties provided a Republican majority or plurality,[3] and Nixon won Mora County by a mere thirty votes. At the other extreme, solidly Republican Lea County in the Plains region was won by Nixon by 55.4 percent, and Lincoln County, which had not voted Democrat since Franklin Roosevelt’s 1936 landslide,[3] by 55.9 percent.
Results
| Party | Candidate | Votes | % | ±% | |
|---|---|---|---|---|---|
| Republican |
|
235,606 | 61.05% | +9.20 | |
| Democratic | 141,084 | 36.56% | −3.19 | ||
| American Independent | 8,767 | 2.27% | −5.59 | ||
| Socialist Workers | 474 | 0.12% | +0.04 | ||
| Total votes | 385,931 | 100.00% | |||
| Republican win | |||||
Results by county
| County | Richard Milhous Nixon Republican |
George Stanley McGovern Democratic |
John George Schmitz[4] American Independent |
Linda Jenness[4] Socialist Workers |
Margin | |||||
|---|---|---|---|---|---|---|---|---|---|---|
| % | # | % | # | % | # | % | # | % | # | |
| Lincoln | 77.07% | 2,528 | 21.22% | 696 | 1.59% | 52 | 0.12% | 4 | 55.85% | 1,832 |
| Lea | 76.41% | 12,478 | 21.00% | 3,429 | 2.50% | 409 | 0.09% | 15 | 55.41% | 9,049 |
| Curry | 75.85% | 8,392 | 21.84% | 2,416 | 2.22% | 246 | 0.09% | 10 | 54.01% | 5,976 |
| Catron | 73.49% | 829 | 24.02% | 271 | 2.30% | 26 | 0.18% | 2 | 49.47% | 558 |
| Union | 72.50% | 1,545 | 23.28% | 496 | 4.08% | 87 | 0.14% | 3 | 49.23% | 1,049 |
| Roosevelt | 73.03% | 4,727 | 24.90% | 1,612 | 2.04% | 132 | 0.03% | 2 | 48.12% | 3,115 |
| De Baca | 71.82% | 752 | 25.79% | 270 | 2.29% | 24 | 0.10% | 1 | 46.04% | 482 |
| Quay | 71.30% | 3,224 | 25.67% | 1,161 | 2.94% | 133 | 0.09% | 4 | 45.62% | 2,063 |
| Chaves | 70.87% | 11,493 | 26.49% | 4,296 | 2.56% | 415 | 0.07% | 12 | 44.38% | 7,197 |
| San Juan | 67.55% | 10,788 | 26.90% | 4,296 | 5.18% | 828 | 0.36% | 58 | 40.65% | 6,492 |
| Harding | 68.68% | 522 | 28.95% | 220 | 2.37% | 18 | 0.00% | 0 | 39.74% | 302 |
| Otero | 65.91% | 7,033 | 27.94% | 2,981 | 6.05% | 646 | 0.09% | 10 | 37.98% | 4,052 |
| Sierra | 67.47% | 2,074 | 30.38% | 934 | 2.02% | 62 | 0.13% | 4 | 37.09% | 1,140 |
| Los Alamos | 66.09% | 5,039 | 31.94% | 2,435 | 1.81% | 138 | 0.16% | 12 | 34.16% | 2,604 |
| Eddy | 64.65% | 9,921 | 32.84% | 5,040 | 2.40% | 368 | 0.11% | 17 | 31.81% | 4,881 |
| Torrance | 64.54% | 1,758 | 33.33% | 908 | 2.06% | 56 | 0.07% | 2 | 31.20% | 850 |
| Luna | 63.25% | 2,958 | 33.35% | 1,560 | 3.36% | 157 | 0.04% | 2 | 29.89% | 1,398 |
| Hidalgo | 63.43% | 1,051 | 33.92% | 562 | 2.66% | 44 | 0.00% | 0 | 29.51% | 489 |
| Bernalillo | 60.80% | 79,993 | 37.06% | 48,753 | 2.02% | 2,651 | 0.13% | 165 | 23.75% | 31,240 |
| Doña Ana | 59.76% | 14,562 | 38.64% | 9,416 | 1.51% | 367 | 0.09% | 21 | 21.12% | 5,146 |
| Colfax | 57.88% | 2,663 | 40.32% | 1,855 | 1.78% | 82 | 0.02% | 1 | 17.56% | 808 |
| Valencia | 56.09% | 8,239 | 41.60% | 6,110 | 2.21% | 325 | 0.10% | 14 | 14.49% | 2,129 |
| Socorro | 56.19% | 2,658 | 42.16% | 1,994 | 1.52% | 72 | 0.13% | 6 | 14.04% | 664 |
| Santa Fe | 52.53% | 12,211 | 46.29% | 10,761 | 1.10% | 255 | 0.08% | 19 | 6.24% | 1,450 |
| Grant | 50.46% | 4,431 | 46.48% | 4,081 | 2.98% | 262 | 0.08% | 7 | 3.99% | 350 |
| Guadalupe | 51.37% | 1,297 | 47.60% | 1,202 | 0.91% | 23 | 0.12% | 3 | 3.76% | 95 |
| Sandoval | 50.25% | 3,507 | 47.18% | 3,293 | 2.42% | 169 | 0.14% | 10 | 3.07% | 214 |
| McKinley | 49.74% | 5,366 | 47.49% | 5,124 | 2.53% | 273 | 0.24% | 26 | 2.24% | 242 |
| Taos | 50.49% | 3,617 | 48.46% | 3,472 | 0.91% | 65 | 0.14% | 10 | 2.02% | 145 |
| Mora | 50.26% | 1,165 | 48.96% | 1,135 | 0.65% | 15 | 0.13% | 3 | 1.29% | 30 |
| San Miguel | 47.71% | 4,434 | 50.18% | 4,663 | 1.88% | 175 | 0.23% | 21 | -2.46% | -229 |
| Rio Arriba | 42.68% | 4,351 | 55.34% | 5,642 | 1.88% | 192 | 0.10% | 10 | -12.66% | -1,291 |
References
- ↑ "1972 Presidential General Election Results – New Mexico". Dave Leip’s Atlas of U.S. Presidential Elections. Retrieved February 11, 2018.
- ↑ Dave Leip’s Atlas of US Presidential Elections; 1972 Presidential General Election Data Graphs – New Mexico by County
- 1 2 Sullivan, Robert David; ‘How the Red and Blue Map Evolved Over the Past Century’; America Magazine in The National Catholic Review; June 29, 2016
- 1 2 Our Campaigns; NM US President 1972