| |||||||||||||||||||||||||||||||||
| Turnout | 77.24% (of registered voters) 57.04% (of eligible voters) | ||||||||||||||||||||||||||||||||
|---|---|---|---|---|---|---|---|---|---|---|---|---|---|---|---|---|---|---|---|---|---|---|---|---|---|---|---|---|---|---|---|---|---|
| |||||||||||||||||||||||||||||||||
 County Results
| |||||||||||||||||||||||||||||||||
| |||||||||||||||||||||||||||||||||
.jpg.webp)
| Elections in California |
|---|
 |
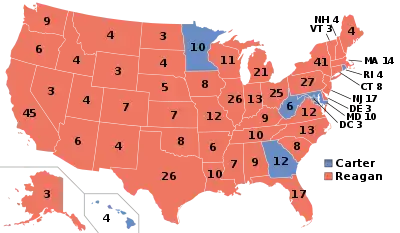
The 1980 United States presidential election in California took place on November 4, 1980 as part of the 1980 United States presidential election. State voters chose 45 representatives, or electors, to the Electoral College, who voted for president and vice president.
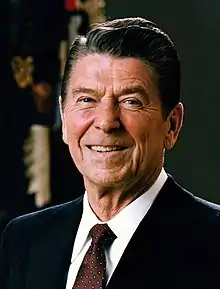
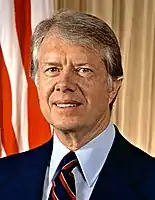
California voted for the Republican nominee, the state's former governor Ronald Reagan, in a landslide over the Democratic incumbent, Jimmy Carter. Reagan won his home state by a wide 16.78% point margin and carried all but three counties. Reagan was the first Republican to win Plumas since 1920, Shasta County since 1952, and Sierra County since 1956.[2] Carter carried only three of the state's 58 counties: Alameda, San Francisco and Yolo.
1980 marks the most recent election in which California voted more Republican than the United States as a whole.[3] Reagan is also the last Republican candidate to carry the counties of Marin and Santa Cruz in a presidential election. This election indeed constitutes the most Republican California has voted relative to the whole nation since 1928; here, it was widely believed that Carter lacked understanding of critical Western issues, most importantly water development.[4] This also remains the last time a Republican won the San Francisco Bay Area, and the last one in which San Francisco gave less than 60% of the vote to the Democratic candidate. As of 2020, this is the last presidential election in which California voted more Republican than Texas.
Primaries
| Candidate | Votes | Delegates |
|---|---|---|
| Ted Kennedy | 1,507,142 | 151 |
| Jimmy Carter | 1,266,216 | 127 |
| Jerry Brown | 135,962 | 0 |
| Others | 71,779 | 0 |
| Uncommitted | 382,759 | 38 |
| Totals | 3,363,858 | 317 |
| Candidate | Votes | Delegates |
|---|---|---|
| Ronald Reagan | 2,057,923 | 146 |
| John Anderson | 349,315 | 25 |
| George H.W. Bush | 125,113 | 0 |
| Others | 31,707 | 0 |
| Totals | 2,564,058 | 171 |
Results
| 1980 United States presidential election in California[5] | |||||
|---|---|---|---|---|---|
| Party | Candidate | Votes | Percentage | Electoral votes | |
| Republican | Ronald Reagan | 4,524,858 | 52.69% | 45 | |
| Democratic | Jimmy Carter (incumbent) | 3,083,661 | 35.91% | 0 | |
| Independent | John B. Anderson | 739,833 | 8.62% | 0 | |
| Libertarian | Ed Clark | 148,434 | 1.73% | 0 | |
| Independent | Barry Commoner | 61,063 | 0.71% | 0 | |
| Peace and Freedom | Maureen Smith | 18,116 | 0.21% | 0 | |
| American Independent | John Rarick | 9,856 | 0.11% | 0 | |
| No party | Gus Hall (write-in) | 847 | 0.01% | 0 | |
| No party | Andrew Pulley (write-in) | 231 | 0.00% | 0 | |
| No party | Percy Greaves, Jr. (write-in) | 87 | 0.00% | 0 | |
| No party | Ben Bubar (write-in) | 36 | 0.00% | 0 | |
| No party | Write-ins | 26 | 0.00% | 0 | |
| No party | Deirdre Griswold (write-in) | 15 | 0.00% | 0 | |
| Invalid or blank votes | — | ||||
| Totals | 8,587,063 | 100.00% | 45 | ||
| Voter turnout | — | ||||
Results by county
| County | Ronald Wilson Reagan[6] Republican |
James Earl Carter[6] Democratic |
John B. Anderson[7] Independent |
Edward E. Clark[7] Libertarian |
Various candidates[7] Other parties |
Margin | ||||||
|---|---|---|---|---|---|---|---|---|---|---|---|---|
| % | # | % | # | % | # | % | # | % | # | % | # | |
| Orange | 67.90% | 529,797 | 22.65% | 176,704 | 7.09% | 55,299 | 1.85% | 14,426 | 0.51% | 3,986 | 45.25% | 353,093 |
| Inyo | 64.79% | 5,201 | 25.91% | 2,080 | 6.42% | 515 | 1.76% | 141 | 1.12% | 90 | 38.88% | 3,121 |
| Modoc | 64.48% | 2,579 | 26.15% | 1,046 | 7.32% | 293 | 1.40% | 56 | 0.65% | 26 | 38.33% | 1,533 |
| Glenn | 64.80% | 5,386 | 26.79% | 2,227 | 6.46% | 537 | 1.46% | 121 | 0.49% | 41 | 38.01% | 3,159 |
| Mono | 62.32% | 2,132 | 25.29% | 865 | 8.83% | 302 | 2.72% | 93 | 0.85% | 29 | 37.03% | 1,267 |
| Sutter | 63.47% | 11,778 | 27.50% | 5,103 | 5.87% | 1,089 | 2.57% | 476 | 0.60% | 111 | 35.97% | 6,675 |
| San Diego | 60.81% | 435,910 | 27.26% | 195,410 | 9.41% | 67,491 | 1.50% | 10,769 | 1.02% | 7,286 | 33.55% | 240,500 |
| Ventura | 60.28% | 114,930 | 29.54% | 56,311 | 7.81% | 14,887 | 1.75% | 3,341 | 0.62% | 1,181 | 30.74% | 58,619 |
| Calaveras | 58.92% | 6,054 | 29.94% | 3,076 | 7.55% | 776 | 2.60% | 267 | 0.99% | 102 | 28.98% | 2,978 |
| Nevada | 57.91% | 15,207 | 28.96% | 7,605 | 8.51% | 2,235 | 3.39% | 891 | 1.23% | 323 | 28.95% | 7,602 |
| El Dorado | 58.27% | 21,238 | 29.53% | 10,765 | 9.02% | 3,287 | 2.36% | 861 | 0.82% | 298 | 28.74% | 10,473 |
| Riverside | 59.87% | 145,642 | 31.51% | 76,650 | 6.73% | 16,362 | 1.40% | 3,406 | 0.50% | 1,218 | 28.36% | 68,992 |
| Butte | 57.85% | 38,188 | 29.57% | 19,520 | 9.25% | 6,108 | 1.96% | 1,292 | 1.37% | 904 | 28.28% | 18,668 |
| San Bernardino | 59.68% | 172,957 | 31.67% | 91,790 | 6.59% | 19,106 | 1.49% | 4,317 | 0.57% | 1,642 | 28.01% | 81,167 |
| Tehama | 59.13% | 9,140 | 31.26% | 4,832 | 6.56% | 1,014 | 2.18% | 337 | 0.87% | 134 | 27.87% | 4,308 |
| Alpine | 55.10% | 254 | 28.85% | 133 | 10.85% | 50 | 2.60% | 12 | 2.60% | 12 | 26.25% | 121 |
| San Luis Obispo | 55.56% | 38,631 | 29.50% | 20,508 | 12.09% | 8,407 | 1.91% | 1,330 | 0.94% | 651 | 26.06% | 18,123 |
| Kern | 59.65% | 72,842 | 33.65% | 41,097 | 4.75% | 5,799 | 1.53% | 1,865 | 0.42% | 518 | 26.00% | 31,745 |
| Colusa | 58.00% | 2,897 | 32.13% | 1,605 | 6.51% | 325 | 2.44% | 122 | 0.92% | 46 | 25.87% | 1,292 |
| Shasta | 58.09% | 27,547 | 32.40% | 15,364 | 6.79% | 3,220 | 2.02% | 960 | 0.69% | 327 | 25.69% | 12,183 |
| Del Norte | 57.48% | 4,016 | 33.46% | 2,338 | 6.96% | 486 | 1.30% | 91 | 0.80% | 56 | 24.02% | 1,678 |
| Trinity | 54.96% | 3,048 | 31.27% | 1,734 | 9.12% | 506 | 3.21% | 178 | 1.44% | 80 | 23.69% | 1,314 |
| Amador | 55.85% | 5,401 | 33.00% | 3,191 | 8.15% | 788 | 2.15% | 208 | 0.85% | 82 | 22.85% | 2,210 |
| Tulare | 58.32% | 41,317 | 35.51% | 25,155 | 4.58% | 3,244 | 1.13% | 801 | 0.46% | 329 | 22.81% | 16,162 |
| Santa Barbara | 53.98% | 69,629 | 31.51% | 40,650 | 11.46% | 14,786 | 1.58% | 2,035 | 1.47% | 1,895 | 22.47% | 28,979 |
| Siskiyou | 55.75% | 9,331 | 33.84% | 5,664 | 7.58% | 1,269 | 1.91% | 320 | 0.92% | 154 | 21.91% | 3,667 |
| Yuba | 56.28% | 7,942 | 34.70% | 4,896 | 6.22% | 878 | 2.08% | 294 | 0.72% | 101 | 21.58% | 3,046 |
| Mariposa | 54.96% | 3,082 | 33.68% | 1,889 | 8.17% | 458 | 1.78% | 100 | 1.41% | 79 | 21.28% | 1,193 |
| Monterey | 54.67% | 47,452 | 33.51% | 29,086 | 9.23% | 8,008 | 1.69% | 1,468 | 0.90% | 780 | 21.16% | 18,366 |
| Placer | 54.78% | 28,179 | 33.65% | 17,311 | 8.47% | 4,356 | 2.37% | 1,217 | 0.73% | 377 | 21.13% | 10,868 |
| Tuolumne | 54.85% | 8,810 | 33.92% | 5,449 | 8.65% | 1390 | 1.80% | 289 | 0.78% | 125 | 20.93% | 3,361 |
| Napa | 53.67% | 23,632 | 33.83% | 14,898 | 9.58% | 4,218 | 2.05% | 902 | 0.87% | 385 | 19.84% | 8,734 |
| San Joaquin | 55.38% | 64,718 | 35.56% | 41,551 | 7.20% | 8,416 | 1.32% | 1,541 | 0.55% | 637 | 19.82% | 23,167 |
| Imperial | 55.92% | 12,068 | 36.89% | 7,961 | 5.57% | 1,203 | 1.15% | 248 | 0.46% | 99 | 19.03% | 4,107 |
| Lassen | 54.45% | 4,464 | 35.87% | 2,941 | 6.62% | 543 | 1.98% | 162 | 1.07% | 88 | 18.58% | 1,523 |
| Lake | 53.64% | 8,934 | 35.90% | 5,978 | 6.95% | 1,157 | 2.53% | 422 | 0.98% | 163 | 17.74% | 2,956 |
| San Benito | 53.33% | 4,054 | 36.16% | 2,749 | 7.26% | 552 | 2.50% | 190 | 0.75% | 57 | 17.17% | 1,305 |
| Kings | 55.37% | 10,531 | 38.37% | 7,299 | 4.74% | 901 | 1.16% | 220 | 0.37% | 70 | 17.00% | 3,232 |
| Plumas | 51.24% | 4,182 | 35.67% | 2,911 | 9.59% | 783 | 1.97% | 161 | 1.52% | 124 | 15.57% | 1,271 |
| Humboldt | 49.39% | 24,047 | 35.15% | 17,113 | 11.17% | 5,440 | 2.27% | 1,105 | 2.03% | 987 | 14.24% | 6,934 |
| Madera | 53.58% | 10,599 | 39.35% | 7,783 | 5.12% | 1,013 | 1.34% | 266 | 0.60% | 119 | 14.23% | 2,816 |
| Santa Clara | 48.02% | 229,048 | 35.01% | 166,995 | 13.73% | 65,481 | 2.32% | 11,051 | 0.93% | 4,428 | 13.01% | 62,053 |
| Contra Costa | 50.12% | 144,112 | 37.35% | 107,398 | 9.81% | 28,209 | 1.80% | 5,175 | 0.92% | 2,651 | 12.77% | 36,714 |
| Solano | 50.72% | 40,919 | 38.37% | 30,952 | 8.32% | 6,713 | 1.82% | 1,468 | 0.77% | 624 | 12.35% | 9,967 |
| San Mateo | 48.82% | 116,491 | 36.60% | 87,335 | 11.73% | 27,985 | 1.99% | 4,744 | 0.87% | 2,082 | 12.22% | 29,156 |
| Sonoma | 48.20% | 60,722 | 36.19% | 45,596 | 11.17% | 14,068 | 2.30% | 2,903 | 2.14% | 2,696 | 12.01% | 15,126 |
| Sierra | 49.77% | 855 | 37.89% | 651 | 9.08% | 156 | 1.86% | 32 | 1.40% | 24 | 11.88% | 204 |
| Fresno | 51.13% | 82,515 | 40.43% | 65,254 | 6.65% | 10,727 | 1.14% | 1,835 | 0.65% | 1,055 | 10.70% | 17,261 |
| Los Angeles | 50.18% | 1,224,533 | 40.15% | 979,830 | 7.21% | 175,882 | 1.55% | 37,832 | 0.91% | 22,108 | 10.03% | 244,703 |
| Marin | 45.78% | 49,678 | 36.16% | 39,231 | 12.72% | 13,805 | 2.45% | 2,660 | 2.89% | 3,133 | 9.62% | 10,447 |
| Stanislaus | 49.41% | 41,595 | 40.01% | 33,683 | 8.47% | 7,134 | 1.45% | 1,224 | 0.65% | 550 | 9.40% | 7,912 |
| Sacramento | 47.72% | 153,721 | 40.37% | 130,031 | 9.21% | 29,655 | 1.80% | 5,810 | 0.90% | 2,903 | 7.35% | 23,690 |
| Mendocino | 44.05% | 12,432 | 38.21% | 10,784 | 9.73% | 2,747 | 4.00% | 1,130 | 4.01% | 1,131 | 5.84% | 1,648 |
| Merced | 48.77% | 18,043 | 42.94% | 15,886 | 6.26% | 2,316 | 1.39% | 516 | 0.64% | 235 | 5.83% | 2,157 |
| Santa Cruz | 43.53% | 37,347 | 37.70% | 32,346 | 12.34% | 10,590 | 2.72% | 2,332 | 3.72% | 3,189 | 5.83% | 5,001 |
| Yolo | 39.45% | 19,603 | 43.32% | 21,527 | 13.42% | 6,669 | 1.82% | 905 | 1.98% | 986 | -3.87% | -1,924 |
| Alameda | 37.96% | 158,531 | 48.30% | 201,720 | 9.78% | 40,834 | 1.78% | 7,436 | 2.18% | 9,096 | -10.34% | -43,189 |
| San Francisco | 31.87% | 80,967 | 52.43% | 133,184 | 11.56% | 29,365 | 1.61% | 4,080 | 2.53% | 6,432 | -20.56% | -52,217 |
References
- ↑ "Historical Voter Registration and Participation in Statewide General Elections 1910-2018" (PDF). California Secretary of State. Retrieved May 5, 2022.
- ↑ Sullivan, Robert David; ‘How the Red and Blue Map Evolved Over the Past Century’; America Magazine in The National Catholic Review; June 29, 2016
- ↑ Counting the Votes; California Archived 2016-12-31 at the Wayback Machine
- ↑ Reisner, Marc; Cadillac Desert: The American West and Its Disappearing Water; p. 11 ISBN 0140178244
- ↑ "1980 Presidential General Election Results – California". Dave Leip's U.S. Election Atlas. Retrieved August 25, 2008.
- 1 2 Géoelections; 1980 Presidential Election Popular Vote (.xlsx file for €15)
- 1 2 3 Géoelections; Popular Vote for John B. Anderson (.xlsx file for €15)