| |||||||||||||||||||||||||||||||||||||||||||||||||||||||||||||||||||||
All 79 seats of Cornwall County Council 40 seats needed for a majority | |||||||||||||||||||||||||||||||||||||||||||||||||||||||||||||||||||||
|---|---|---|---|---|---|---|---|---|---|---|---|---|---|---|---|---|---|---|---|---|---|---|---|---|---|---|---|---|---|---|---|---|---|---|---|---|---|---|---|---|---|---|---|---|---|---|---|---|---|---|---|---|---|---|---|---|---|---|---|---|---|---|---|---|---|---|---|---|---|
| |||||||||||||||||||||||||||||||||||||||||||||||||||||||||||||||||||||
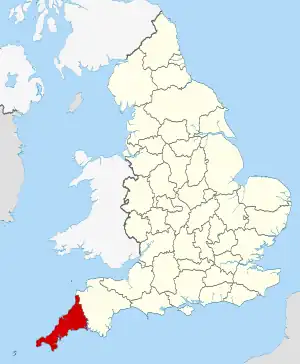 The County of Cornwall within England | |||||||||||||||||||||||||||||||||||||||||||||||||||||||||||||||||||||
| |||||||||||||||||||||||||||||||||||||||||||||||||||||||||||||||||||||
Elections to Cornwall County Council were held on 7 May 1981.[2]
Results summary
| Party | Seats | Gains | Losses | Net gain/loss | Seats % | Votes % | Votes | +/− | |
|---|---|---|---|---|---|---|---|---|---|
| Independent | 43 | 54.4 | 42.7 | 41,847 | |||||
| Conservative | 16 | 20.3 | 18.3 | 17,924 | |||||
| Alliance | 12 | 15.2 | 21.8 | 21,363 | |||||
| Labour | 6 | 7.6 | 10.9 | 10,639 | |||||
| Ecology | 1 | 1.3 | 0.8 | 791 | |||||
| Voice of the People | 1 | 1.3 | 1.5 | 1,498 | New | ||||
| Mebyon Kernow | 0 | 0.0 | 3.4 | 3,331 | |||||
| Residents | 0 | 0.0 | 0.6 | 592 | |||||
References
- ↑ "Local Election Summaries 1981". The Elections Centre. Retrieved 21 June 2019.
- 1 2 Rallings, Colin; Thrasher, Michael. "Local Elections Handbook 1981". pp. 6–7.
| County councils (England) |
|
|---|---|
| County councils (Wales) |
|
| Metropolitan counties |
|
| Unicameral area | |
| District councils (Northern Ireland) | |
| Sui generis |
|
| Cornwall Council | |
|---|---|
| Council of the Isles of Scilly | |
| Caradon District Council |
|
| Carrick District Council |
|
| Kerrier District Council |
|
| North Cornwall District Council |
|
| Penwith District Council | |
| Restormel Borough Council | |
| |
This article is issued from Wikipedia. The text is licensed under Creative Commons - Attribution - Sharealike. Additional terms may apply for the media files.