| |||||||||||||||||||||||||||||
| |||||||||||||||||||||||||||||
 County Results
| |||||||||||||||||||||||||||||
| |||||||||||||||||||||||||||||
.jpg.webp)
.jpg.webp)
| Elections in New York State |
|---|
 |

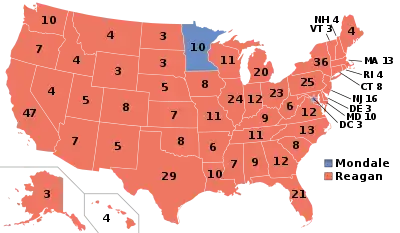
The 1984 United States presidential election in New York took place on November 6, 1984, as part of the 1984 United States presidential election. All 50 States and the District of Columbia participated in this election. Voters in New York chose 36 representatives, or electors to the Electoral College, who selected president and vice president.
New York was won by Ronald Reagan with 53.84% of the popular vote over Walter Mondale with 45.83%, a victory margin of 8.01%.[1] This made New York about 10% more Democratic than the nation overall. This was the third election since the Civil War (the first two being 1952 and 1956), in which New York voted less Democratic than neighboring Pennsylvania.
The county results indicate a then-typical[1] split between New York's rural upstate and the large suburban counties around New York City, on the one hand, and the urban centers of New York City, Buffalo, and Albany, on the other. While Mondale carried the four most heavily populated boroughs of New York City overall with 61% of the vote, the strong Republican performance across most of the upstate as well as in the heavily-populated suburban counties of Nassau, Suffolk, and Westchester was able to secure the state's electoral votes for Reagan.
A portent of the future was seen in Mondale carrying Tompkins County, home of the college town of Ithaca. He was only the third Democrat to do so since the Civil War, after Woodrow Wilson in 1912 and Lyndon B. Johnson in 1964;[2] Reagan thus became the first-ever Republican to win the White House without carrying this county since the Republican Party's founding in 1854. Mondale managing to win Tompkins County even whilst losing the national popular vote by over 18% indicated the county's strong Democratic trend; it has given every subsequent Democratic nominee a double-digit margin, every Democrat from 2004 on over 60%, and every Democrat from 2008 on over 66% of its vote.
As of 2020, this remains the last time that New York has been carried by a Republican presidential nominee, as well as the last time that Schenectady County has done so.[3] Broome and Niagara counties would not vote Republican again until 2016, although this election remains the last time a Republican won a majority in the former.
Results
| 1984 United States presidential election in New York | |||||
|---|---|---|---|---|---|
| Party | Candidate | Votes | Percentage | Electoral votes | |
| Republican | Ronald Reagan | 3,376,519 | 49.61% | ||
| Conservative | Ronald Reagan | 288,244 | 4.23% | ||
| Total | Ronald Reagan (incumbent) | 3,664,763 | 53.84% | 36 | |
| Democratic | Walter Mondale | 3,119,609 | 44.09% | ||
| Liberal | Walter Mondale | 118,324 | 1.74% | ||
| Total | Walter Mondale | 3,119,609 | 45.83% | 0 | |
| Free Libertarian | David Bergland | 11,949 | 0.18% | 0 | |
| Communist Party | Gus Hall | 4,226 | 0.06% | 0 | |
| New Alliance | Dennis Serrette | 3,200 | 0.05% | 0 | |
| Workers World | Larry Holmes | 2,226 | 0.03% | 0 | |
| Write-in | 837 | 0.01% | 0 | ||
| Totals | 6,806,810 | 100.0% | 36 | ||
New York City results
| 1984 Presidential Election in New York City | Manhattan | The Bronx | Brooklyn | Queens | Staten Island | Total | |||
| Democratic- Liberal |
Walter Mondale | 379,521 | 223,112 | 368,518 | 328,379 | 44,345 | 1,343,875 | 60.96% | |
| 72.06% | 66.86% | 61.34% | 53.34% | 34.69% | |||||
| Republican- Conservative |
Ronald Reagan | 144,281 | 109,308 | 230,064 | 285,477 | 83,187 | 852,317 | 38.66% | |
| 27.39% | 32.76% | 38.29% | 46.38% | 65.08% | |||||
| Free Libertarian | David Bergland | 988 | 347 | 744 | 676 | 161 | 2,916 | 0.13% | |
| 0.19% | 0.10% | 0.12% | 0.11% | 0.13% | |||||
| Communist | Gus Hall | 940 | 335 | 663 | 497 | 44 | 2,479 | 0.11% | |
| 0.18% | 0.10% | 0.11% | 0.08% | 0.03% | |||||
| New Alliance | Dennis L. Serrette | 619 | 379 | 505 | 331 | 36 | 1,870 | 0.08% | |
| 0.12% | 0.11% | 0.08% | 0.05% | 0.03% | |||||
| Workers’ World | Larry Holmes | 295 | 186 | 266 | 218 | 31 | 996 | 0.05% | |
| 0.06% | 0.06% | 0.04% | 0.04% | 0.02% | |||||
| TOTAL | 526,671 | 333,683 | 600,771 | 615,578 | 127,826 | 2,204,529 | 100.00% | ||
Results by county
| County | Ronald Wilson Reagan Republican |
Walter Frederick Mondale Democratic |
Various candidates Other parties |
Margin | Total votes cast | ||||
|---|---|---|---|---|---|---|---|---|---|
| # | % | # | % | # | % | # | % | ||
| Albany | 74,542 | 49.50% | 75,447 | 50.10% | 603 | 0.40% | -905 | -0.60% | 150,592 |
| Allegany | 14,527 | 75.25% | 4,720 | 24.45% | 57 | 0.30% | 9,807 | 50.80% | 19,304 |
| Bronx | 109,308 | 32.76% | 223,112 | 66.86% | 1,263 | 0.38% | -113,804 | -34.11% | 333,683 |
| Broome | 58,109 | 60.47% | 37,658 | 39.19% | 322 | 0.34% | 20,451 | 21.28% | 96,089 |
| Cattaraugus | 24,162 | 70.10% | 10,194 | 29.58% | 112 | 0.32% | 13,968 | 40.52% | 34,468 |
| Cayuga | 21,451 | 63.50% | 12,207 | 36.14% | 121 | 0.36% | 9,244 | 27.37% | 33,779 |
| Chautauqua | 39,597 | 63.13% | 22,986 | 36.65% | 141 | 0.22% | 16,611 | 26.48% | 62,724 |
| Chemung | 24,909 | 62.83% | 14,638 | 36.92% | 100 | 0.25% | 10,271 | 25.91% | 39,647 |
| Chenango | 14,254 | 69.03% | 6,343 | 30.72% | 51 | 0.25% | 7,911 | 38.31% | 20,648 |
| Clinton | 19,549 | 64.22% | 10,804 | 35.49% | 90 | 0.30% | 8,745 | 28.73% | 30,443 |
| Columbia | 18,814 | 67.46% | 8,960 | 32.13% | 117 | 0.42% | 9,854 | 35.33% | 27,891 |
| Cortland | 13,691 | 67.70% | 6,438 | 31.83% | 95 | 0.47% | 7,253 | 35.86% | 20,224 |
| Delaware | 14,002 | 70.61% | 5,745 | 28.97% | 83 | 0.42% | 8,257 | 41.64% | 19,830 |
| Dutchess | 70,324 | 67.89% | 32,867 | 31.73% | 389 | 0.38% | 37,457 | 36.16% | 103,580 |
| Erie | 222,882 | 48.28% | 237,631 | 51.47% | 1,158 | 0.25% | -14,749 | -3.19% | 461,671 |
| Essex | 12,114 | 69.94% | 5,119 | 29.56% | 87 | 0.50% | 6,995 | 40.39% | 17,320 |
| Franklin | 10,617 | 62.22% | 6,400 | 37.51% | 47 | 0.28% | 4,217 | 24.71% | 17,064 |
| Fulton | 14,887 | 65.82% | 7,644 | 33.80% | 87 | 0.38% | 7,243 | 32.02% | 22,618 |
| Genesee | 16,582 | 65.78% | 8,549 | 33.91% | 79 | 0.31% | 8,033 | 31.86% | 25,210 |
| Greene | 14,150 | 70.50% | 5,858 | 29.19% | 62 | 0.31% | 8,292 | 41.32% | 20,070 |
| Hamilton | 2,637 | 77.97% | 737 | 21.79% | 8 | 0.24% | 1,900 | 56.18% | 3,382 |
| Herkimer | 18,827 | 64.35% | 10,346 | 35.36% | 85 | 0.29% | 8,481 | 28.99% | 29,258 |
| Jefferson | 23,445 | 67.96% | 10,960 | 31.77% | 91 | 0.26% | 12,485 | 36.19% | 34,496 |
| Kings | 230,064 | 38.29% | 368,518 | 61.34% | 2,189 | 0.36% | -138,454 | -23.05% | 600,771 |
| Lewis | 7,069 | 71.69% | 2,757 | 27.96% | 34 | 0.34% | 4,312 | 43.73% | 9,860 |
| Livingston | 16,389 | 68.60% | 7,399 | 30.97% | 104 | 0.44% | 8,990 | 37.63% | 23,892 |
| Madison | 17,568 | 67.67% | 8,291 | 31.93% | 104 | 0.40% | 9,277 | 35.73% | 25,963 |
| Monroe | 182,696 | 57.76% | 132,109 | 41.77% | 1,472 | 0.47% | 50,587 | 15.99% | 316,277 |
| Montgomery | 14,398 | 61.22% | 9,044 | 38.45% | 78 | 0.33% | 5,354 | 22.76% | 23,520 |
| Nassau | 392,017 | 61.83% | 240,697 | 37.96% | 1,349 | 0.21% | 151,320 | 23.87% | 634,063 |
| New York | 144,281 | 27.39% | 379,521 | 72.06% | 2,869 | 0.54% | -235,240 | -44.67% | 526,671 |
| Niagara | 51,289 | 55.23% | 41,368 | 44.55% | 201 | 0.22% | 9,921 | 10.68% | 92,858 |
| Oneida | 65,377 | 60.38% | 42,603 | 39.35% | 289 | 0.27% | 22,774 | 21.03% | 108,269 |
| Onondaga | 121,857 | 59.64% | 81,777 | 40.03% | 680 | 0.33% | 40,080 | 19.62% | 204,314 |
| Ontario | 24,507 | 65.36% | 12,844 | 34.26% | 143 | 0.38% | 11,663 | 31.11% | 37,494 |
| Orange | 69,413 | 67.78% | 32,663 | 31.89% | 337 | 0.33% | 36,750 | 35.88% | 102,413 |
| Orleans | 10,543 | 70.17% | 4,429 | 29.48% | 52 | 0.35% | 6,114 | 40.69% | 15,024 |
| Oswego | 31,481 | 68.39% | 14,347 | 31.17% | 206 | 0.45% | 17,134 | 37.22% | 46,034 |
| Otsego | 16,777 | 63.28% | 9,582 | 36.14% | 152 | 0.57% | 7,195 | 27.14% | 26,511 |
| Putnam | 25,707 | 72.87% | 9,473 | 26.85% | 97 | 0.27% | 16,234 | 46.02% | 35,277 |
| Queens | 285,477 | 46.38% | 328,379 | 53.34% | 1,722 | 0.28% | -42,902 | -6.97% | 615,578 |
| Rensselaer | 43,892 | 61.94% | 26,755 | 37.76% | 217 | 0.31% | 17,137 | 24.18% | 70,864 |
| Richmond | 83,187 | 65.08% | 44,345 | 34.69% | 294 | 0.23% | 38,842 | 30.39% | 127,826 |
| Rockland | 70,020 | 60.88% | 44,687 | 38.85% | 311 | 0.27% | 25,333 | 22.03% | 115,018 |
| St. Lawrence | 26,062 | 61.83% | 15,963 | 37.87% | 124 | 0.29% | 10,099 | 23.96% | 42,149 |
| Saratoga | 47,394 | 67.91% | 22,166 | 31.76% | 228 | 0.33% | 25,228 | 36.15% | 69,788 |
| Schenectady | 42,808 | 58.09% | 30,612 | 41.54% | 277 | 0.38% | 12,196 | 16.55% | 73,697 |
| Schoharie | 8,692 | 67.97% | 3,996 | 31.25% | 100 | 0.78% | 4,696 | 36.72% | 12,788 |
| Schuyler | 5,207 | 67.98% | 2,422 | 31.62% | 31 | 0.40% | 2,785 | 36.36% | 7,660 |
| Seneca | 9,420 | 65.84% | 4,825 | 33.72% | 62 | 0.43% | 4,595 | 32.12% | 14,307 |
| Steuben | 28,848 | 73.19% | 10,471 | 26.56% | 98 | 0.25% | 18,377 | 46.62% | 39,417 |
| Suffolk | 335,485 | 66.03% | 171,295 | 33.72% | 1,276 | 0.25% | 164,190 | 32.32% | 508,056 |
| Sullivan | 18,037 | 63.09% | 10,475 | 36.64% | 78 | 0.27% | 7,562 | 26.45% | 28,590 |
| Tioga | 14,856 | 71.36% | 5,860 | 28.15% | 101 | 0.49% | 8,996 | 43.21% | 20,817 |
| Tompkins | 18,255 | 48.32% | 19,357 | 51.24% | 165 | 0.44% | -1,102 | -2.92% | 37,777 |
| Ulster | 47,372 | 63.93% | 26,445 | 35.69% | 285 | 0.38% | 20,927 | 28.24% | 74,102 |
| Warren | 17,616 | 74.75% | 5,886 | 24.97% | 66 | 0.28% | 11,730 | 49.77% | 23,568 |
| Washington | 16,580 | 73.48% | 5,909 | 26.19% | 74 | 0.33% | 10,671 | 47.29% | 22,563 |
| Wayne | 24,171 | 70.98% | 9,700 | 28.49% | 180 | 0.53% | 14,471 | 42.50% | 34,051 |
| Westchester | 229,005 | 58.67% | 160,225 | 41.05% | 1,078 | 0.28% | 68,780 | 17.62% | 390,308 |
| Wyoming | 11,199 | 71.69% | 4,381 | 28.04% | 42 | 0.27% | 6,818 | 43.64% | 15,622 |
| Yates | 6,367 | 70.26% | 2,670 | 29.46% | 25 | 0.28% | 3,697 | 40.80% | 9,062 |
| Totals | 3,664,763 | 53.84% | 3,119,609 | 45.83% | 22,438 | 0.33% | 545,154 | 8.01% | 6,806,810 |
See also
References
- 1 2 "1984 Presidential General Election Results – New York". U.S. Election Atlas. Retrieved February 6, 2013.
- ↑ Menendez, Albert J.; The Geography of Presidential Elections in the United States, 1868-2004, pp. 261-265 ISBN 0786422173
- ↑ Sullivan, Robert David; ‘How the Red and Blue Map Evolved Over the Past Century’; America Magazine in The National Catholic Review; June 29, 2016