| |||||||||||||||||||||||||||||||||||||||||||||||||||||||||||||||||||||||||||||
22 of 66 seats (One Third) to Wirral Metropolitan Borough Council 34 seats needed for a majority | |||||||||||||||||||||||||||||||||||||||||||||||||||||||||||||||||||||||||||||
|---|---|---|---|---|---|---|---|---|---|---|---|---|---|---|---|---|---|---|---|---|---|---|---|---|---|---|---|---|---|---|---|---|---|---|---|---|---|---|---|---|---|---|---|---|---|---|---|---|---|---|---|---|---|---|---|---|---|---|---|---|---|---|---|---|---|---|---|---|---|---|---|---|---|---|---|---|---|
| Turnout | 69.1% ( | ||||||||||||||||||||||||||||||||||||||||||||||||||||||||||||||||||||||||||||
| |||||||||||||||||||||||||||||||||||||||||||||||||||||||||||||||||||||||||||||
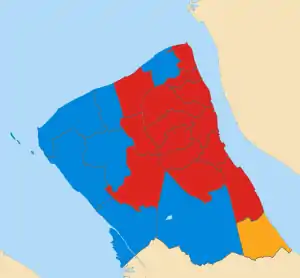 Map of results of 2015 election | |||||||||||||||||||||||||||||||||||||||||||||||||||||||||||||||||||||||||||||
| |||||||||||||||||||||||||||||||||||||||||||||||||||||||||||||||||||||||||||||

The 2015 Wirral Metropolitan Borough Council election took place on 7 May 2015 to elect members of Wirral Metropolitan Borough Council in England.[1] This election was held on the same day as other local elections.
After the election, the composition of the council was:
| Party | Seats | ± | |
|---|---|---|---|
| Labour | 39 | ||
| Conservative | 21 | ||
| Liberal Democrat | 5 | ||
| Green | 1 | ||
Election results
Overall election result
Overall result compared with 2014.
| Wirral Metropolitan Borough Council election result, 2015 | |||||||||||||||
|---|---|---|---|---|---|---|---|---|---|---|---|---|---|---|---|
| Party | Candidates | Votes | |||||||||||||
| Stood | Elected | Gained | Unseated | Net | % of total | % | No. | Net % | |||||||
| Labour | 22 | 14 | 1 | 0 | 63.6 | 47.9 | 79,409 | ||||||||
| Conservative | 21 | 7 | 0 | 0 | 31.8 | 28.1 | 46,611 | ||||||||
| UKIP | 20 | 0 | 0 | 0 | 0.0 | 9.0 | 14,919 | ||||||||
| Liberal Democrats | 18 | 1 | 0 | 1 | 4.5 | 8.2 | 13,572 | ||||||||
| Green | 22 | 0 | 0 | 0 | 0.0 | 6.3 | 10,446 | ||||||||
| TUSC | 6 | 0 | 0 | 0 | 0.0 | 0.4 | 632 | ||||||||
| Independent | 3 | 0 | 0 | 0 | 0.0 | 0.1 | 195 | ||||||||
Changes in council composition
Prior to the election the composition of the council was:
| 38 | 21 | 6 | 1 |
| Lab | Con | LD | G |
After the election the composition of the council was:
| 39 | 21 | 5 | 1 |
| Lab | Con | LD | G |

Wirral Metropolitan Borough Council composition after the 2015 election
Ward results
Bebington
| Party | Candidate | Votes | % | ±% | |
|---|---|---|---|---|---|
| Labour | Jerry Williams | 5,107 | 57.7 | ||
| Conservative | Des Drury | 2,106 | 23.8 | ||
| UKIP | Jim Bradshaw | 931 | 10.5 | ||
| Green | Anthony Smith | 452 | 5.1 | ||
| Liberal Democrats | Brian Gill | 261 | 2.9 | ||
| Majority | 3,001 | 33.9 | |||
| Registered electors | 12,107 | ||||
| Turnout | 73.7 | ||||
| Labour hold | Swing | ||||
Bidston and St James
| Party | Candidate | Votes | % | ±% | |
|---|---|---|---|---|---|
| Labour | Brian Kenny | 4,255 | 76.9 | ||
| Conservative | Geoffrey Dormand | 590 | 10.7 | ||
| Green | Karl Cumings | 316 | 5.7 | ||
| TUSC | Ben Halligan | 199 | 3.6 | ||
| Liberal Democrats | Roy Wood | 175 | 3.2 | ||
| Majority | 3,665 | 66.2 | |||
| Registered electors | 10,049 | ||||
| Turnout | 56.0 | ||||
| Labour hold | Swing | ||||
Birkenhead and Tranmere
| Party | Candidate | Votes | % | ±% | |
|---|---|---|---|---|---|
| Labour | Phillip Davies | 3,130 | 56.0 | ||
| Green | Jayne Clough | 1,763 | 31.6 | ||
| UKIP | Laurence Sharpe-Stevens | 447 | 8.0 | ||
| Conservative | June Cowin | 183 | 3.3 | ||
| Liberal Democrats | Mary Price | 61 | 1.1 | New | |
| Majority | 1,367 | 24.5 | N/A | ||
| Registered electors | 9,854 | ||||
| Turnout | 56.9 | ||||
| Labour hold | Swing | ||||
Bromborough
| Party | Candidate | Votes | % | ±% | |
|---|---|---|---|---|---|
| Labour | Joe Walsh | 4,478 | 59.3 | ||
| Conservative | Mike Collins | 1,396 | 18.5 | ||
| UKIP | Sue Colquhoun | 865 | 11.5 | ||
| Liberal Democrats | Penelope Golby | 367 | 4.9 | ||
| Green | Percy Hogg | 330 | 4.4 | ||
| TUSC | Mark Halligan | 118 | 1.6 | New | |
| Majority | 3,082 | 40.8 | |||
| Registered electors | 11,464 | ||||
| Turnout | 66.3 | ||||
| Labour hold | Swing | ||||
Clatterbridge
| Party | Candidate | Votes | % | ±% | |
|---|---|---|---|---|---|
| Conservative | Adam Sykes | 3,656 | 41.3 | ||
| Labour | Jenny Holliday | 3,371 | 38.1 | ||
| UKIP | Roger Jones | 864 | 9.8 | ||
| Liberal Democrats | Jan Cambridge | 644 | 7.3 | ||
| Green | Vinny Spencer | 323 | 3.6 | ||
| Majority | 285 | 3.2 | |||
| Registered electors | 11,689 | ||||
| Turnout | 76.2 | ||||
| Conservative hold | Swing | ||||
Claughton
| Party | Candidate | Votes | % | ±% | |
|---|---|---|---|---|---|
| Labour | Stephen Foulkes | 4,101 | 56.8 | ||
| Conservative | Barbara Sinclair | 1,309 | 18.1 | ||
| UKIP | Philip Griffiths | 810 | 11.2 | ||
| Liberal Democrats | Christopher Teggin | 512 | 7.1 | ||
| Green | Tom Cubbin | 488 | 6.8 | ||
| Majority | 2,792 | 38.7 | |||
| Registered electors | 11,266 | ||||
| Turnout | 64.5 | ||||
| Labour hold | Swing | ||||
Eastham
| Party | Candidate | Votes | % | ±% | |
|---|---|---|---|---|---|
| Liberal Democrats | Dave Mitchell | 3,589 | 45.1 | ||
| Labour | Helen Robinson | 2,772 | 34.8 | ||
| Conservative | Keith Jack | 1,314 | 16.5 | ||
| Green | Paul Cartlidge | 291 | 3.7 | ||
| Majority | 817 | 10.3 | |||
| Registered electors | 11,089 | ||||
| Turnout | 72.5 | ||||
| Liberal Democrats hold | Swing | ||||
Greasby, Frankby and Irby
| Party | Candidate | Votes | % | ±% | |
|---|---|---|---|---|---|
| Conservative | David Burgess-Joyce | 3,655 | 40.4 | ||
| Labour | Julie McManus | 2,980 | 33.0 | ||
| Liberal Democrats | Peter Reisdorf | 1,330 | 14.7 | ||
| UKIP | Laurence Jones | 723 | 8.0 | ||
| Green | Catherine Page | 352 | 3.9 | ||
| Majority | 675 | 7.4 | |||
| Registered electors | 11,583 | ||||
| Turnout | 78.4 | ||||
| Conservative hold | Swing | ||||
Heswall
| Party | Candidate | Votes | % | ±% | |
|---|---|---|---|---|---|
| Conservative | Andrew Hodson | 5,035 | 59.5 | ||
| Labour | Mike Holliday | 1,718 | 20.3 | ||
| UKIP | David Scott | 715 | 8.4 | ||
| Liberal Democrats | David Tyrrell | 535 | 6.3 | ||
| Green | Barbara Burton | 464 | 5.4 | ||
| Majority | 3,317 | 39.2 | |||
| Registered electors | 10,874 | ||||
| Turnout | 78.5 | ||||
| Conservative hold | Swing | ||||
Hoylake and Meols
| Party | Candidate | Votes | % | ±% | |
|---|---|---|---|---|---|
| Conservative | Gerry Ellis | 4,125 | 50.8 | ||
| Labour | Bill McGenity | 2,367 | 29.1 | ||
| Green | Yvonne McGinley | 758 | 9.3 | ||
| UKIP | George Robinson | 497 | 6.1 | ||
| Liberal Democrats | Michael Redfern | 374 | 4.6 | ||
| Majority | 1,758 | 21.7 | |||
| Registered electors | 10,610 | ||||
| Turnout | 77.0 | ||||
| Conservative hold | Swing | ||||
Leasowe and Moreton East
| Party | Candidate | Votes | % | ±% | |
|---|---|---|---|---|---|
| Labour | Ron Abbey | 4,297 | 60.8 | ||
| Conservative | Denis Knowles | 1,744 | 24.7 | ||
| UKIP | Jan Davison | 734 | 10.4 | ||
| Green | Craig Reynolds | 291 | 4.1 | ||
| Majority | 2,553 | 36.1 | |||
| Registered electors | 10,764 | ||||
| Turnout | 65.9 | ||||
| Labour hold | Swing | ||||
Liscard
| Party | Candidate | Votes | % | ±% | |
|---|---|---|---|---|---|
| Labour | Bernie Mooney | 4,397 | 62.9 | ||
| UKIP | Lynda Williams | 1,352 | 19.4 | ||
| Liberal Democrats | Daniel Clein | 578 | 8.3 | ||
| Green | Lindsey Stowell-Smith | 542 | 7.8 | ||
| TUSC | Adam Khan | 118 | 1.7 | New | |
| Majority | 3,045 | 43.5 | |||
| Registered electors | 11,091 | ||||
| Turnout | 64.5 | ||||
| Labour hold | Swing | ||||
Moreton West and Saughall Massie
| Party | Candidate | Votes | % | ±% | |
|---|---|---|---|---|---|
| Conservative | Steve Williams | 3,324 | 44.3 | ||
| Labour | Karl Greaney | 3,191 | 42.5 | ||
| UKIP | Susan Whitham | 716 | 9.5 | ||
| Green | Perle Sheldricks | 272 | 3.6 | ||
| Majority | 133 | 1.8 | |||
| Registered electors | 10,860 | ||||
| Turnout | 69.3 | ||||
| Conservative hold | Swing | ||||
New Brighton
| Party | Candidate | Votes | % | ±% | |
|---|---|---|---|---|---|
| Labour | Patrick Hackett | 3,822 | 52.5 | ||
| Conservative | Tony Pritchard | 2,223 | 30.6 | ||
| Green | Gillian Homeri | 634 | 8.7 | ||
| UKIP | Tim Power | 595 | 8.2 | ||
| Majority | 1,599 | 21.9 | |||
| Registered electors | 11,003 | ||||
| Turnout | 66.4 | ||||
| Labour hold | Swing | ||||
Oxton
| Party | Candidate | Votes | % | ±% | |
|---|---|---|---|---|---|
| Labour | Paul Doughty [n 1] | 3,085 | 39.7 | ||
| Liberal Democrats | Stuart Kelly | 2,788 | 35.9 | ||
| Conservative | Hilary Jones | 854 | 11.0 | ||
| UKIP | David Martin | 615 | 7.9 | ||
| Green | Liz Heydon | 424 | 5.5 | ||
| Majority | 297 | 3.8 | N/A | ||
| Registered electors | 11,236 | ||||
| Turnout | 69.4 | ||||
| Labour gain from Liberal Democrats | Swing | ||||
Pensby and Thingwall
| Party | Candidate | Votes | % | ±% | |
|---|---|---|---|---|---|
| Labour | Phillip Brightmore | 3,085 | 39.1 | ||
| Conservative | Ian MacKenzie | 2,918 | 36.9 | ||
| UKIP | Hilary Jones | 796 | 10.1 | ||
| Liberal Democrats | Damien Cummins | 602 | 7.6 | ||
| Green | Allen Burton | 378 | 4.8 | ||
| Independent | Maureen Wilkinson | 69 | 0.9 | New | |
| TUSC | Phil Simpson | 50 | 0.6 | New | |
| Majority | 167 | 2.2 | |||
| Registered electors | 10,589 | ||||
| Turnout | 75.2 | ||||
| Labour hold | Swing | ||||
Prenton
| Party | Candidate | Votes | % | ±% | |
|---|---|---|---|---|---|
| Labour | Angela Davies | 4,362 | 59.3 | ||
| Conservative | Robert Hughes | 1,307 | 17.8 | ||
| UKIP | James Shorthall | 864 | 11.7 | ||
| Liberal Democrats | Allan Brame | 481 | 6.5 | ||
| Green | Moira Gommon | 342 | 4.6 | ||
| Majority | 3,055 | 41.5 | |||
| Registered electors | 10,790 | ||||
| Turnout | 68.4 | ||||
| Labour hold | Swing | ||||
Rock Ferry
| Party | Candidate | Votes | % | ±% | |
|---|---|---|---|---|---|
| Labour | Chris Meaden | 3,767 | 66.7 | ||
| UKIP | Terry Hansen | 617 | 10.9 | ||
| Conservative | Cy Ferguson | 552 | 9.8 | ||
| Green | Paul Harris | 430 | 7.6 | ||
| Liberal Democrats | Brian Hall | 148 | 2.6 | ||
| TUSC | Morag Reid | 72 | 1.3 | ||
| Independent | Jim Pritchard | 62 | 1.1 | ||
| Majority | 3,150 | 55.8 | |||
| Registered electors | 9,727 | ||||
| Turnout | 58.3 | ||||
| Labour hold | Swing | ||||
Seacombe
| Party | Candidate | Votes | % | ±% | |
|---|---|---|---|---|---|
| Labour | Chris Jones | 4,157 | 71.1 | ||
| UKIP | Christopher Wellstead | 726 | 12.4 | ||
| Conservative | Christine Jones | 581 | 9.9 | ||
| Green | Lily Clough | 244 | 4.2 | ||
| TUSC | Gregory North | 75 | 1.3 | New | |
| Independent | Karl Mercer | 64 | 1.1 | ||
| Majority | 3,431 | 58.7 | |||
| Registered electors | 10,309 | ||||
| Turnout | 57.1 | ||||
| Labour hold | Swing | ||||
Upton
| Party | Candidate | Votes | % | ±% | |
|---|---|---|---|---|---|
| Labour | Tony Smith | 5,347 | 62.4 | ||
| Conservative | Geoffrey Gubb | 1,807 | 21.1 | ||
| UKIP | Geoffrey Caton | 853 | 9.9 | ||
| Green | Marian Hussenbux | 306 | 3.6 | ||
| Liberal Democrats | Alan Davies | 262 | 3.1 | ||
| Majority | 3,540 | 41.3 | |||
| Registered electors | 12,394 | ||||
| Turnout | 69.6 | ||||
| Labour hold | Swing | ||||
Wallasey
| Party | Candidate | Votes | % | ±% | |
|---|---|---|---|---|---|
| Conservative | Paul Hayes | 3,831 | 44.8 | ||
| Labour | Giuseppe Roberto | 3,309 | 38.7 | ||
| UKIP | Brian Farrell | 647 | 7.6 | ||
| Green | Cynthia Stonall | 464 | 5.4 | ||
| Liberal Democrats | John Codling | 302 | 3.5 | ||
| Majority | 522 | 6.1 | |||
| Registered electors | 11,871 | ||||
| Turnout | 72.5 | ||||
| Conservative hold | Swing | ||||
West Kirby and Thurstaston
| Party | Candidate | Votes | % | ±% | |
|---|---|---|---|---|---|
| Conservative | David Elderton | 4,099 | 50.6 | ||
| Labour | Thomas Usher | 2,311 | 28.5 | ||
| Green | Trevor Desrosiers | 582 | 7.2 | ||
| Liberal Democrats | John Cresswell | 563 | 6.9 | ||
| UKIP | Dave Evennett | 552 | 6.8 | ||
| Majority | 1,788 | 22.1 | |||
| Registered electors | 10,380 | ||||
| Turnout | 78.7 | ||||
| Conservative hold | Swing | ||||
Changes between 2015 and 2016
| Date | Ward | Name | Previous affiliation | New affiliation | Circumstance | ||
|---|---|---|---|---|---|---|---|
| ? | Bromborough | Steve Niblock | Labour | Independent | Deselected.[56] | ||
Notes
• italics denote the sitting councillor • bold denotes the winning candidate
References
- 1 2 3 "Election Result for 7 May 2015 Summary". Wirral Metropolitan Borough Council.
- ↑ "Local Election Results 2015 Wirral". Local Elections Archive Project.
- ↑ "Election Result for Bebington ward on 7 May 2015". Wirral Metropolitan Borough Council.
- ↑ "Councillor Jerry Williams". Wirral Metropolitan Borough Council.
- ↑ "Election Result for Bidston and St James ward on 7 May 2015". Wirral Metropolitan Borough Council.
- ↑ "Councillor Brian Kenny". Wirral Metropolitan Borough Council. Archived from the original on 12 June 2018. Retrieved 26 September 2018.
- ↑ "Election Result for Birkenhead and Tranmere ward on 7 May 2015". Wirral Metropolitan Borough Council.
- ↑ "Councillor Phil Davies". Wirral Metropolitan Borough Council. Archived from the original on 12 June 2018. Retrieved 26 September 2018.
- ↑ "Election Result for Bromborough ward on 7 May 2015". Wirral Metropolitan Borough Council.
- ↑ "Councillor Joe Walsh". Wirral Metropolitan Borough Council. Archived from the original on 9 August 2018. Retrieved 26 September 2018.
- ↑ "Councillor Michael Collins". Wirral Metropolitan Borough Council. Retrieved 8 May 2019.
- ↑ "Election Result for Clatterbridge ward on 7 May 2015". Wirral Metropolitan Borough Council.
- ↑ "Councillor Adam Sykes". Wirral Metropolitan Borough Council. Archived from the original on 25 June 2018. Retrieved 26 September 2018.
- ↑ "Election Result for Claughton ward on 7 May 2015". Wirral Metropolitan Borough Council.
- ↑ "Councillor Steve Foulkes". Wirral Metropolitan Borough Council.
- ↑ "Election Result for Eastham ward on 7 May 2015". Wirral Metropolitan Borough Council.
- ↑ "Councillor Dave Mitchell". Wirral Metropolitan Borough Council. Archived from the original on 12 June 2018. Retrieved 26 September 2018.
- ↑ "Election Result for Greasby, Frankby and Irby ward on 7 May 2015". Wirral Metropolitan Borough Council.
- ↑ "Councillor David Burgess-Joyce". Wirral Metropolitan Borough Council.
- ↑ "Councillor Julie McManus". Wirral Metropolitan Borough Council.
- ↑ "Councillor Peter Reisdorf". Wirral Metropolitan Borough Council. Archived from the original on 12 June 2018. Retrieved 26 September 2018.
- ↑ "Election Result for Heswall ward on 7 May 2015". Wirral Metropolitan Borough Council.
- ↑ "Councillor Andrew Hodson". Wirral Metropolitan Borough Council.
- ↑ "Election Result for Hoylake and Meols ward on 7 May 2015". Wirral Metropolitan Borough Council.
- ↑ "Councillor Gerry Ellis". Wirral Metropolitan Borough Council. Archived from the original on 12 June 2018. Retrieved 26 September 2018.
- ↑ "Election Result for Leasowe and Moreton East ward on 7 May 2015". Wirral Metropolitan Borough Council.
- ↑ "Councillor Ron Abbey". Wirral Metropolitan Borough Council. Archived from the original on 12 June 2018. Retrieved 26 September 2018.
- ↑ "Councillor Denis Knowles". Wirral Metropolitan Borough Council. Archived from the original on 12 June 2018. Retrieved 26 September 2018.
- ↑ "Election Result for Liscard ward on 7 May 2015". Wirral Metropolitan Borough Council.
- ↑ "Councillor Bernie Mooney". Wirral Metropolitan Borough Council.
- ↑ "Election Result for Moreton West and Saughall Massie ward on 7 May 2015". Wirral Metropolitan Borough Council.
- ↑ "Councillor Steve Williams". Wirral Metropolitan Borough Council. Archived from the original on 5 July 2018. Retrieved 26 September 2018.
- ↑ "Councillor Karl Greaney". Wirral Metropolitan Borough Council.
- ↑ "Election Result for New Brighton ward on 7 May 2015". Wirral Metropolitan Borough Council.
- ↑ "Councillor Pat Hackett". Wirral Metropolitan Borough Council. Archived from the original on 12 June 2018. Retrieved 26 September 2018.
- ↑ "Councillor Tony Pritchard". Wirral Metropolitan Borough Council. Archived from the original on 12 June 2018. Retrieved 26 September 2018.
- ↑ "Election Result for Oxton ward on 7 May 2015". Wirral Metropolitan Borough Council.
- ↑ "Councillor Paul Doughty". Wirral Metropolitan Borough Council. Archived from the original on 12 July 2018. Retrieved 26 September 2018.
- ↑ "Councillor Stuart Kelly". Wirral Metropolitan Borough Council.
- ↑ "Election Result for Pensby and Thingwall ward on 7 May 2015". Wirral Metropolitan Borough Council.
- ↑ "Councillor Phillip Brightmore". Wirral Metropolitan Borough Council.
- ↑ "Election Result for Prenton ward on 7 May 2015". Wirral Metropolitan Borough Council.
- ↑ "Councillor Angela Davies". Wirral Metropolitan Borough Council.
- ↑ "Councillor Allan Brame". Wirral Metropolitan Borough Council.
- ↑ "Election Result for Rock Ferry ward on 7 May 2015". Wirral Metropolitan Borough Council.
- ↑ "Councillor Chris Meaden". Wirral Metropolitan Borough Council. Archived from the original on 12 June 2018. Retrieved 26 September 2018.
- ↑ "Election Result for Seacombe ward on 7 May 2015". Wirral Metropolitan Borough Council.
- ↑ "Councillor Chris Jones". Wirral Metropolitan Borough Council. Archived from the original on 12 July 2018. Retrieved 26 September 2018.
- ↑ "Election Result for Upton ward on 7 May 2015". Wirral Metropolitan Borough Council.
- ↑ "Councillor Tony Smith". Wirral Metropolitan Borough Council. Archived from the original on 12 June 2018. Retrieved 26 September 2018.
- ↑ "Election Result for Wallasey ward on 7 May 2015". Wirral Metropolitan Borough Council.
- ↑ "Councillor Paul Hayes". Wirral Metropolitan Borough Council. Archived from the original on 12 June 2018. Retrieved 26 September 2018.
- ↑ "Election Result for West Kirby and Thurstaston ward on 7 May 2015". Wirral Metropolitan Borough Council.
- ↑ "Councillor David M Elderton". Wirral Metropolitan Borough Council. Archived from the original on 12 June 2018. Retrieved 26 September 2018.
- ↑ "Councillor Thomas Usher". Wirral Metropolitan Borough Council.
- ↑ "Battle lines drawn for Wirral's council elections on May 5". Wirral Globe. 9 April 2016. Retrieved 31 December 2018.
This article is issued from Wikipedia. The text is licensed under Creative Commons - Attribution - Sharealike. Additional terms may apply for the media files.