Churk
Churk Ghurma | |
|---|---|
city | |
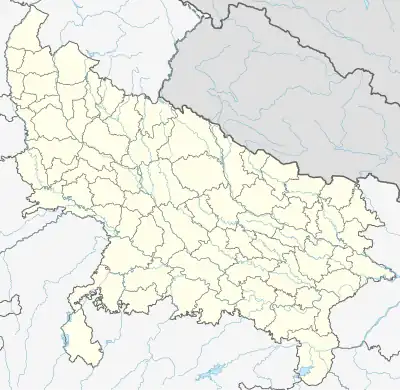 Churk Location in Uttar Pradesh, India | |
| Coordinates: 24°39′N 83°06′E / 24.650°N 83.100°E | |
| Country | |
| State | Uttar Pradesh |
| District | Sonbhadra |
| Population (2001) | |
| • Total | 8,685 |
| Languages | |
| • Official | Hindi |
| Time zone | UTC+5:30 (IST) |
Churk Ghurma is a town and a nagar panchayat in Sonbhadra district in the state of Uttar Pradesh, India. The town is famous for a cement factory which was previously owned by state government. Later, the factory was sold to Jaypee Cements.
Demographics
As of 2001 India census,[1] Churk Ghurma had a population of 8,685. Males constitute 53% of the population and females 47%. Churk Ghurma has an average literacy rate of 70%, higher than the national average of 59.5%: male literacy is 79% and, female literacy is 61%. In Churk Ghurma, 14% of the population is under 6 years of age.
Climate
| Climate data for Churk (1981–2010, extremes 1981–2010) | |||||||||||||
|---|---|---|---|---|---|---|---|---|---|---|---|---|---|
| Month | Jan | Feb | Mar | Apr | May | Jun | Jul | Aug | Sep | Oct | Nov | Dec | Year |
| Record high °C (°F) | 30.8 (87.4) |
35.8 (96.4) |
40.2 (104.4) |
44.8 (112.6) |
49.0 (120.2) |
47.4 (117.3) |
43.2 (109.8) |
39.0 (102.2) |
38.6 (101.5) |
38.0 (100.4) |
32.5 (90.5) |
30.0 (86.0) |
49.0 (120.2) |
| Mean daily maximum °C (°F) | 22.5 (72.5) |
25.7 (78.3) |
32.1 (89.8) |
38.1 (100.6) |
40.5 (104.9) |
37.8 (100.0) |
32.3 (90.1) |
31.3 (88.3) |
31.1 (88.0) |
30.2 (86.4) |
27.7 (81.9) |
24.1 (75.4) |
31.1 (88.0) |
| Mean daily minimum °C (°F) | 9.0 (48.2) |
11.7 (53.1) |
16.7 (62.1) |
22.2 (72.0) |
25.9 (78.6) |
26.6 (79.9) |
25.3 (77.5) |
24.8 (76.6) |
23.9 (75.0) |
20.3 (68.5) |
14.4 (57.9) |
10.1 (50.2) |
19.3 (66.7) |
| Record low °C (°F) | −0.6 (30.9) |
0.0 (32.0) |
8.4 (47.1) |
14.5 (58.1) |
15.4 (59.7) |
8.6 (47.5) |
18.8 (65.8) |
21.5 (70.7) |
18.2 (64.8) |
11.8 (53.2) |
3.4 (38.1) |
0.0 (32.0) |
−0.6 (30.9) |
| Average rainfall mm (inches) | 14.6 (0.57) |
18.8 (0.74) |
13.4 (0.53) |
9.0 (0.35) |
20.2 (0.80) |
109.1 (4.30) |
290.4 (11.43) |
274.3 (10.80) |
187.2 (7.37) |
34.8 (1.37) |
4.1 (0.16) |
8.4 (0.33) |
984.4 (38.76) |
| Average rainy days | 1.3 | 1.6 | 0.8 | 0.9 | 1.7 | 5.7 | 12.8 | 12.0 | 9.0 | 2.4 | 0.3 | 0.7 | 49.3 |
| Average relative humidity (%) (at 17:30 IST) | 62 | 56 | 41 | 29 | 33 | 52 | 75 | 80 | 79 | 72 | 65 | 61 | 59 |
| Source: India Meteorological Department[2] | |||||||||||||
References
- ↑ "Census of India 2001: Data from the 2001 Census, including cities, villages and towns (Provisional)". Census Commission of India. Archived from the original on 16 June 2004. Retrieved 1 November 2008.
- ↑ "Station: Churk Climatological Table 1981–2010" (PDF). Climatological Normals 1981–2010. India Meteorological Department. January 2015. pp. 197–198. Archived from the original (PDF) on 5 February 2020. Retrieved 6 May 2020.
This article is issued from Wikipedia. The text is licensed under Creative Commons - Attribution - Sharealike. Additional terms may apply for the media files.