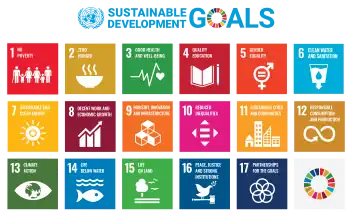
The Union Territory of Jammu and Kashmir has a better performance than the average in India with respect to Sustainable Development Goals indicators such as poverty, hunger, energy and climate action. However, with regard to indicators such as health, decent work, economic growth and education, the union territory performs worse than the national average. Other indicators for the UT such as female literacy and sex ratio is also lower than the national average.
In comparison with average for India
Sustainable Development Goals (2020-21)

| SDGs | UT of JK | India avg | Diff |
|---|---|---|---|
| GOAL 1: No Poverty | 69 | 60 | |
| GOAL 2: Zero Hunger | 71 | 47 | |
| GOAL 3: Good Health and Well-being | 70 | 74 | |
| GOAL 4: Quality Education | 49 | 57 | |
| GOAL 5: Gender Equality | 46 | 48 | |
| GOAL 6: Clean Water and Sanitation | 88 | 83 | |
| GOAL 7: Affordable and Clean Energy | 100 | 92 | |
| GOAL 8: Decent Work and Economic Growth | 47 | 61 | |
| GOAL 9: Industry, Innovation and Infrastructure | 42 | 55 | |
| GOAL 10: Reduced Inequality | 65 | 67 | |
| GOAL 11: Sustainable Cities and Communities | 57 | 79 | |
| GOAL 12: Responsible Consumption and Production | 95 | 74 | |
| GOAL 13: Climate Action | 63 | 54 | |
| GOAL 14: Life Below Water | - | - | - |
| GOAL 15: Life on Land | 52 | 66 | |
| GOAL 16: Peace and Justice Strong Institutions | 74 | 74 | |
| GOAL 17: Partnerships to achieve the Goal | - | - | - |
| Composite SDG | 66 | 66[lower-alpha 1] |
- Notes:
- ↑ India ranks 120th on the SDG index
Major Comparable indicators
| Item/indicator | Ref Year | Magnitude | Ref Year | Magnitude |
|---|---|---|---|---|
| Per capita GDP at current prices | 2015-16 | 86379 | 2015-16 | 105746 |
| Life Expectancy at Birth | 2011 | 69.30 | 2011-15 | 64.60 |
| Literacy rate (Over all) | 2011 | 67.16 | 2011 | 74.04 |
| Male literacy rate | 2011 | 76.75 | 2011 | 82.14 |
| Female literacy rate | 2011 | 56.43 | 2011 | 65.46 |
| BPL population (Total) | 2011-12 | 10.40 | 2011-12 | 21.90 |
| Workers as %age of total Population | 2011 | 34.47 | 2011 | 39.79 |
| Sex Ratio | 2011 | 889 | 2011 | 940 |
| Road length per lakh of population (km) | 2015-16 | 274.39 | 2015 | 4519 |
| Registered Vehicles per lakh of population | 2016 | 10971 | 2012 | 13172 |
References
- ↑ "SDG INDIA Index & Dashboard 2020-21: Partnerships in the Decade of Action" (PDF). NITI Aayog, Government of India. United Nations. p. 66. Archived (PDF) from the original on 3 June 2021. Retrieved 21 October 2021.
{{cite web}}: CS1 maint: others (link) - ↑ Indicators of Economic Development. Directorate of Economics & Statistics Jammu and Kashmir. Accessed on 21 October 2021.
Further reading
- IANS (27 December 2021). "Real estate MoUs to Haldiram, industrial development in J&K gets a boost". Business Standard India.
- Shrivastava, Rahul (19 October 2021). "J&K administration signs MoU with Dubai govt to develop real estate, industrial parks". India Today.
- "Development Works in J&K". Press Information Bureau, Government of India. 10 March 2021.
Good Governance Index
- "District Good Governance Index: Jammu tops followed by Doda, Samba". Hindustan Times. 23 January 2022.
- "HM launches District Good Governance Index in J&K". Greater Kashmir. 23 January 2022.
- Bhat, Gulzar (22 January 2022). "District Good Governance Index of J&K released by Amit Shah just an exercise in optics, say analysts". National Herald.
This article is issued from Wikipedia. The text is licensed under Creative Commons - Attribution - Sharealike. Additional terms may apply for the media files.