This is a list of electoral results for the Electoral district of Kew in Victorian state elections.
Members for Kew
| Order | Image | Member | Party | Term | Notes | |
|---|---|---|---|---|---|---|
| 1 | 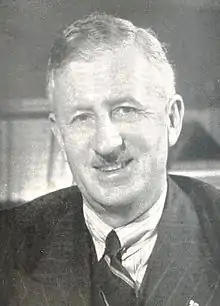 |
Wilfrid Kent Hughes (1895–1970) |
Nationalist | 9 April 1927 – 1931 |
Served as minister under McPherson and Argyle. Served as Deputy Premier under Argyle and Hollway. Retired. Later held the federal seat of Chisholm and served as minister under Menzies.[1] | |
| United Australia | 1931–1945 | |||||
| Liberal / LCP | 1945 – 31 October 1949 | |||||
| 2 | 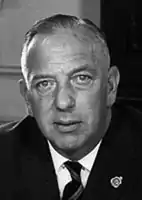 |
Arthur Rylah (1909–1974) |
LCP / Liberal | 17 December 1949 – 5 March 1971 |
Served as Deputy Premier under Bolte. Retired.[2] | |
| 3 | 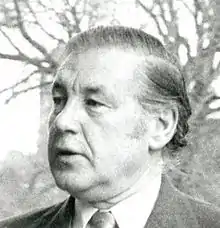 |
Dick Hamer (1916–2004) |
Liberal | 17 April 1971 – 17 July 1981 |
Previously a member of the Victorian Legislative Council. Served as minister under Bolte. Served as Premier from 1972 to 1981. Retired.[3] | |
| 4 | Prue Sibree (1946–) |
Liberal | 15 August 1981 – 19 March 1988 |
Retired.[4] | ||
| 5 | Jan Wade (1937–) |
Liberal | 19 March 1988 – 17 September 1999 |
Served as minister under Kennett. Retired.[5] | ||
| 6 |  |
Andrew McIntosh (1955–) |
Liberal | 18 September 1999 – 29 November 2014 |
Served as minister under Baillieu and Napthine. Resigned.[6] | |
| 7 | .jpg.webp) |
Tim Smith (1983–) |
Liberal | 29 November 2014 – 26 November 2022 |
Retired.[7] | |
| 8 | Jess Wilson (1990–) |
Liberal | 26 November 2022 – present |
Incumbent. | ||
Election results
Elections in the 2020s
| Party | Candidate | Votes | % | ±% | |
|---|---|---|---|---|---|
| Liberal | Jess Wilson | 19,321 | 44.3 | −5.0 | |
| Labor | Lucy Skelton | 9,896 | 22.7 | −8.8 | |
| Independent | Sophie Torney | 9,200 | 21.1 | +21.1 | |
| Greens | Jackie Carter | 3,612 | 8.3 | −6.9 | |
| Family First | Ann Seeley | 751 | 1.7 | +1.7 | |
| Animal Justice | Ruby Schofield | 507 | 1.2 | −0.9 | |
| Independent | Finlay Davis | 158 | 0.4 | +0.4 | |
| Independent | Kym Sullivan | 147 | 0.3 | +0.3 | |
| Total formal votes | 43,592 | 97.0 | +1.1 | ||
| Informal votes | 1,367 | 3.0 | −1.1 | ||
| Turnout | 44,959 | 90.1 | −2.3 | ||
| Two-party-preferred result | |||||
| Liberal | Jess Wilson | 23,529 | 54.0 | −0.7 | |
| Labor | Lucy Skelton | 20,063 | 46.0 | +0.7 | |
| Liberal hold | Swing | –0.7 | |||
Elections in the 2010s
| Party | Candidate | Votes | % | ±% | |
|---|---|---|---|---|---|
| Liberal | Tim Smith | 19,098 | 49.26 | −7.93 | |
| Labor | Marg D'Arcy | 11,960 | 30.85 | +4.35 | |
| Greens | Alex Marks | 5,961 | 15.38 | −0.94 | |
| Animal Justice | Bronwyn Gardiner | 915 | 2.36 | +2.36 | |
| Sustainable Australia | Paul Scaturchio | 835 | 2.15 | +2.15 | |
| Total formal votes | 38,769 | 95.91 | +0.02 | ||
| Informal votes | 1,655 | 4.09 | −0.02 | ||
| Turnout | 40,424 | 91.33 | −2.35 | ||
| Two-party-preferred result | |||||
| Liberal | Tim Smith | 21,231 | 54.78 | −5.87 | |
| Labor | Marg D'Arcy | 17,528 | 45.22 | +5.87 | |
| Liberal hold | Swing | −5.87 | |||
| Party | Candidate | Votes | % | ±% | |
|---|---|---|---|---|---|
| Liberal | Tim Smith | 22,552 | 57.2 | −3.4 | |
| Labor | James Gaffey | 10,448 | 26.5 | +3.2 | |
| Greens | Lynn Frankes | 6,433 | 16.3 | +1.9 | |
| Total formal votes | 39,433 | 95.9 | −0.8 | ||
| Informal votes | 1,691 | 4.1 | +0.8 | ||
| Turnout | 41,124 | 93.7 | +1.1 | ||
| Two-party-preferred result | |||||
| Liberal | Tim Smith | 23,899 | 60.6 | −5.0 | |
| Labor | James Gaffey | 15,510 | 39.4 | +5.0 | |
| Liberal hold | Swing | −5.0 | |||
| Party | Candidate | Votes | % | ±% | |
|---|---|---|---|---|---|
| Liberal | Andrew McIntosh | 19,878 | 60.09 | +6.35 | |
| Labor | Kate Jackson | 7,750 | 23.43 | -3.96 | |
| Greens | Emma Henley | 4,879 | 14.75 | -1.34 | |
| Family First | Timothy Hunter | 576 | 1.74 | -0.21 | |
| Total formal votes | 33,083 | 96.65 | -0.64 | ||
| Informal votes | 1,145 | 3.35 | +0.64 | ||
| Turnout | 34,228 | 92.75 | +1.12 | ||
| Two-party-preferred result | |||||
| Liberal | Andrew McIntosh | 21,560 | 65.19 | +5.63 | |
| Labor | Kate Jackson | 11,512 | 34.81 | -5.63 | |
| Liberal hold | Swing | +5.63 | |||
Elections in the 2000s
| Party | Candidate | Votes | % | ±% | |
|---|---|---|---|---|---|
| Liberal | Andrew McIntosh | 17,269 | 53.7 | +4.2 | |
| Labor | Maree Williams | 8,801 | 27.4 | -3.7 | |
| Greens | Emma Henley | 5,170 | 16.1 | -1.3 | |
| Family First | Wallis Pattinsonn | 628 | 2.0 | +2.0 | |
| Independent | John Dobinson | 267 | 0.8 | +0.8 | |
| Total formal votes | 32,135 | 97.3 | +0.1 | ||
| Informal votes | 896 | 2.7 | -0.1 | ||
| Turnout | 33,031 | 91.6 | |||
| Two-party-preferred result | |||||
| Liberal | Andrew McIntosh | 19,131 | 59.6 | +3.6 | |
| Labor | Maree Williams | 12,990 | 40.4 | -3.6 | |
| Liberal hold | Swing | +3.6 | |||
| Party | Candidate | Votes | % | ±% | |
|---|---|---|---|---|---|
| Liberal | Andrew McIntosh | 15,807 | 49.5 | -12.2 | |
| Labor | Maree Williams | 9,926 | 31.1 | -2.8 | |
| Greens | Cheryl Clark | 5,543 | 17.4 | +17.4 | |
| Democrats | Mary Dettman | 638 | 2.0 | +2.0 | |
| Total formal votes | 31,914 | 97.2 | -0.4 | ||
| Informal votes | 930 | 2.8 | +0.4 | ||
| Turnout | 32,844 | 92.6 | |||
| Two-party-preferred result | |||||
| Liberal | Andrew McIntosh | 17,865 | 56.0 | -7.8 | |
| Labor | Maree Williams | 14,049 | 44.0 | +7.8 | |
| Liberal hold | Swing | -7.8 | |||
Elections in the 1990s
| Party | Candidate | Votes | % | ±% | |
|---|---|---|---|---|---|
| Liberal | Andrew McIntosh | 19,594 | 61.8 | -1.9 | |
| Labor | Jonathan Lewes | 10,751 | 33.9 | +1.1 | |
| Hope | Peter Hale | 1,380 | 4.3 | +4.3 | |
| Total formal votes | 31,725 | 97.6 | -0.6 | ||
| Informal votes | 795 | 2.4 | +0.6 | ||
| Turnout | 32,520 | 91.2 | |||
| Two-party-preferred result | |||||
| Liberal | Andrew McIntosh | 20,247 | 63.8 | -1.2 | |
| Labor | Jonathan Lewes | 11,478 | 36.2 | +1.2 | |
| Liberal hold | Swing | -1.2 | |||
| Party | Candidate | Votes | % | ±% | |
|---|---|---|---|---|---|
| Liberal | Jan Wade | 19,946 | 63.7 | -4.2 | |
| Labor | Bill Elms | 10,275 | 32.8 | +9.2 | |
| Natural Law | Gabrielle Dewan | 1,101 | 3.5 | +3.5 | |
| Total formal votes | 31,322 | 98.2 | +1.2 | ||
| Informal votes | 587 | 1.8 | -1.2 | ||
| Turnout | 31,909 | 93.2 | |||
| Two-party-preferred result | |||||
| Liberal | Jan Wade | 20,339 | 65.0 | -6.5 | |
| Labor | Bill Elms | 10,949 | 35.0 | +6.5 | |
| Liberal hold | Swing | -6.5 | |||
| Party | Candidate | Votes | % | ±% | |
|---|---|---|---|---|---|
| Liberal | Jan Wade | 20,484 | 67.9 | +5.6 | |
| Labor | Wayne Clarke | 7,115 | 23.6 | -14.2 | |
| Independent | Jonathan Shepherd | 2,570 | 8.5 | +8.5 | |
| Total formal votes | 30,169 | 97.0 | +0.3 | ||
| Informal votes | 946 | 3.0 | -0.3 | ||
| Turnout | 31,115 | 94.1 | |||
| Two-party-preferred result | |||||
| Liberal | Jan Wade | 21,553 | 71.5 | +9.3 | |
| Labor | Wayne Clarke | 8,578 | 28.5 | -9.3 | |
| Liberal hold | Swing | +9.3 | |||
Elections in the 1980s
| Party | Candidate | Votes | % | ±% | |
|---|---|---|---|---|---|
| Liberal | Jan Wade | 15,715 | 61.00 | +0.80 | |
| Labor | Tim Muffet | 10,048 | 39.00 | -0.80 | |
| Total formal votes | 25,763 | 96.51 | -0.58 | ||
| Informal votes | 932 | 3.49 | +0.58 | ||
| Turnout | 26,695 | 90.37 | -1.54 | ||
| Liberal hold | Swing | +0.80 | |||
| Party | Candidate | Votes | % | ±% | |
|---|---|---|---|---|---|
| Liberal | Jan Wade | 12,824 | 54.56 | -5.64 | |
| Labor | Tim Muffet | 4,897 | 20.84 | -18.96 | |
| Democrats | Sonia O'Brien | 4,607 | 19.60 | +19.60 | |
| Democratic Labor | Mark Beshara | 798 | 3.40 | +3.40 | |
| Independent | Bill Thiele | 377 | 1.60 | +1.60 | |
| Total formal votes | 23,503 | 97.16 | |||
| Informal votes | 686 | 2.84 | |||
| Turnout | 24,189 | 81.40 | |||
| Two-party-preferred result | |||||
| Liberal | Jan Wade | 65.4 | +5.2 | ||
| Labor | Tim Muffet | 34.6 | -5.2 | ||
| Liberal hold | Swing | +5.2 | |||
| Party | Candidate | Votes | % | ±% | |
|---|---|---|---|---|---|
| Liberal | Prue Sibree | 16,403 | 60.2 | +4.4 | |
| Labor | Annamaria Dierer | 10,843 | 39.8 | +5.8 | |
| Total formal votes | 27,246 | 97.1 | |||
| Informal votes | 818 | 2.9 | |||
| Turnout | 28,064 | 91.9 | |||
| Liberal hold | Swing | -0.3 | |||
| Party | Candidate | Votes | % | ±% | |
|---|---|---|---|---|---|
| Liberal | Prue Sibree | 14,123 | 55.8 | +1.4 | |
| Labor | George Theodoridis | 8,615 | 34.0 | +2.7 | |
| Democrats | Veronica Lysaght | 2,569 | 10.2 | +2.9 | |
| Total formal votes | 25,307 | 98.1 | +0.4 | ||
| Informal votes | 499 | 1.9 | -0.4 | ||
| Turnout | 25,806 | 92.7 | +1.5 | ||
| Two-party-preferred result | |||||
| Liberal | Prue Sibree | 15,215 | 60.1 | -1.1 | |
| Labor | George Theodoridis | 10,092 | 39.9 | +1.1 | |
| Liberal hold | Swing | -1.1 | |||
| Party | Candidate | Votes | % | ±% | |
|---|---|---|---|---|---|
| Liberal | Prue Sibree | 9,877 | 49.5 | -4.9 | |
| Labor | Iain Messer | 5,998 | 30.1 | -1.2 | |
| Democrats | Veronica Lysaght | 2,327 | 11.7 | +4.4 | |
| Democratic Labor | Daniel Condon | 1,277 | 6.4 | -0.7 | |
| Independent | Peter Allan | 323 | 1.6 | +1.6 | |
| Independent | Kevin Tehan | 154 | 0.8 | +0.8 | |
| Total formal votes | 19,956 | 97.4 | -0.3 | ||
| Informal votes | 533 | 2.6 | +0.3 | ||
| Turnout | 20,489 | 71.2 | -20.0 | ||
| After distribution of preferences | |||||
| Liberal | Prue Sibree | 10,211 | 51.2 | N/A | |
| Labor | Iain Messer | 6,145 | 30.8 | N/A | |
| Democrats | Veronica Lysaght | 3,600 | 18.0 | N/A | |
| Liberal hold | Swing | N/A | |||
Elections in the 1970s
| Party | Candidate | Votes | % | ±% | |
|---|---|---|---|---|---|
| Liberal | Rupert Hamer | 14,096 | 54.4 | -3.3 | |
| Labor | Wesley Blackmore | 8,102 | 31.3 | +5.1 | |
| Democrats | Keith Bruckner | 1,894 | 7.3 | +7.3 | |
| Democratic Labor | Standish Keon | 1,827 | 7.1 | +2.9 | |
| Total formal votes | 25,919 | 97.7 | -0.4 | ||
| Informal votes | 597 | 2.3 | +0.4 | ||
| Turnout | 26,516 | 91.2 | -0.4 | ||
| Two-party-preferred result | |||||
| Liberal | Rupert Hamer | 15,875 | 61.2 | -8.8 | |
| Labor | Wesley Blackmore | 10,044 | 38.8 | +8.8 | |
| Liberal hold | Swing | -8.8 | |||
| Party | Candidate | Votes | % | ±% | |
|---|---|---|---|---|---|
| Liberal | Rupert Hamer | 15,379 | 57.7 | -6.0 | |
| Labor | Gary Jungwirth | 6,997 | 26.2 | -1.7 | |
| Independent | Charles Barrington | 1,713 | 6.4 | +6.4 | |
| Independent | Margaret Tighe | 1,455 | 5.5 | +5.5 | |
| Democratic Labor | Francis Duffy | 1,121 | 4.2 | -4.1 | |
| Total formal votes | 26,665 | 98.1 | |||
| Informal votes | 516 | 1.9 | |||
| Turnout | 27,181 | 91.6 | |||
| Two-party-preferred result | |||||
| Liberal | Rupert Hamer | 18,670 | 70.0 | -1.1 | |
| Labor | Gary Jungwirth | 7,995 | 30.0 | +1.1 | |
| Liberal hold | Swing | -1.1 | |||
| Party | Candidate | Votes | % | ±% | |
|---|---|---|---|---|---|
| Liberal | Rupert Hamer | 16,018 | 64.7 | +23.0 | |
| Labor | James Hilson | 6,603 | 26.7 | +0.9 | |
| Democratic Labor | Francis Duffy | 2,148 | 8.7 | -5.1 | |
| Total formal votes | 24,769 | 98.0 | +1.2 | ||
| Informal votes | 494 | 2.0 | -1.2 | ||
| Turnout | 25,263 | 90.3 | -2.7 | ||
| Two-party-preferred result | |||||
| Liberal | Rupert Hamer | 17,844 | 72.0 | +12.6 | |
| Labor | James Hilson | 6,925 | 28.0 | -12.6 | |
| Liberal hold | Swing | +12.6 | |||
| Party | Candidate | Votes | % | ±% | |
|---|---|---|---|---|---|
| Liberal | Rupert Hamer | 13,422 | 64.8 | +23.1 | |
| Labor | Rosslyn Ives | 6,325 | 30.5 | +4.7 | |
| Independent | L R Hull | 968 | 4.7 | +4.7 | |
| Total formal votes | 20,715 | 97.7 | +0.5 | ||
| Informal votes | 497 | 2.3 | -0.5 | ||
| Turnout | 21,212 | 82.8 | -10.2 | ||
| Liberal hold | Swing | N/A | |||
- Preferences were not distributed as Hamer won with an absolute majority of votes (50% of votes).
| Party | Candidate | Votes | % | ±% | |
|---|---|---|---|---|---|
| Liberal | Arthur Rylah | 9,692 | 41.7 | -12.9 | |
| Labor | Rosslyn Ives | 5,987 | 25.8 | -1.1 | |
| Democratic Labor | Francis Duffy | 3,212 | 13.8 | -4.7 | |
| Independent | Bertram Wainer | 2,624 | 11.3 | +11.3 | |
| Independent | Dorothy Buchanan | 1,727 | 7.4 | +7.4 | |
| Total formal votes | 23,242 | 96.8 | -0.4 | ||
| Informal votes | 756 | 3.2 | +0.4 | ||
| Turnout | 23,998 | 93.0 | -0.4 | ||
| Two-party-preferred result | |||||
| Liberal | Arthur Rylah | 13,808 | 59.4 | -10.9 | |
| Labor | Rosslyn Ives | 9,434 | 40.6 | +10.9 | |
| Liberal hold | Swing | -10.9 | |||
Elections in the 1960s
| Party | Candidate | Votes | % | ±% | |
|---|---|---|---|---|---|
| Liberal | Arthur Rylah | 12,712 | 54.6 | -3.3 | |
| Labor | Eric Sibly | 6,261 | 26.9 | +0.6 | |
| Democratic Labor | Francis Duffy | 4,305 | 18.5 | +2.7 | |
| Total formal votes | 23,278 | 97.2 | |||
| Informal votes | 664 | 2.8 | |||
| Turnout | 23,942 | 93.4 | |||
| Two-party-preferred result | |||||
| Liberal | Arthur Rylah | 16,372 | 70.3 | -1.1 | |
| Labor | Eric Sibly | 6,906 | 29.7 | +1.1 | |
| Liberal hold | Swing | -1.1 | |||
| Party | Candidate | Votes | % | ±% | |
|---|---|---|---|---|---|
| Liberal and Country | Arthur Rylah | 11,319 | 59.3 | -0.2 | |
| Labor | William Cooper | 4,785 | 25.1 | +2.3 | |
| Democratic Labor | Francis Duffy | 2,991 | 15.7 | -0.2 | |
| Total formal votes | 19,095 | 98.1 | +0.5 | ||
| Informal votes | 378 | 1.9 | -0.5 | ||
| Turnout | 19,473 | 91.0 | -0.9 | ||
| Two-party-preferred result | |||||
| Liberal and Country | Arthur Rylah | 13,861 | 72.6 | -0.6 | |
| Labor | William Cooper | 5,234 | 27.4 | +0.6 | |
| Liberal and Country hold | Swing | -0.6 | |||
| Party | Candidate | Votes | % | ±% | |
|---|---|---|---|---|---|
| Liberal and Country | Arthur Rylah | 11,452 | 59.5 | -3.1 | |
| Labor | William Cooper | 4,384 | 22.8 | +3.3 | |
| Democratic Labor | Francis Duffy | 3,068 | 15.9 | +0.2 | |
| Communist | Eric Thornton | 357 | 1.8 | -0.4 | |
| Total formal votes | 19,261 | 97.6 | -0.5 | ||
| Informal votes | 466 | 2.4 | +0.5 | ||
| Turnout | 19,727 | 91.9 | -0.2 | ||
| Two-party-preferred result | |||||
| Liberal and Country | Arthur Rylah | 14,096 | 73.2 | -3.0 | |
| Labor | William Cooper | 5,165 | 26.8 | +3.0 | |
| Liberal and Country hold | Swing | -3.0 | |||
Elections in the 1950s
| Party | Candidate | Votes | % | ±% | |
|---|---|---|---|---|---|
| Liberal and Country | Arthur Rylah | 12,375 | 62.6 | ||
| Labor | Kevin Lynch | 3,845 | 19.5 | ||
| Democratic Labor | John Buchanan | 3,108 | 15.7 | ||
| Communist | Ralph Gibson | 425 | 2.2 | ||
| Total formal votes | 19,753 | 98.1 | |||
| Informal votes | 372 | 1.9 | |||
| Turnout | 20,125 | 92.1 | |||
| Two-party-preferred result | |||||
| Liberal and Country | Arthur Rylah | 15,058 | 76.2 | ||
| Labor | Kevin Lynch | 4,695 | 23.8 | ||
| Liberal and Country hold | Swing | ||||
| Party | Candidate | Votes | % | ±% | |
|---|---|---|---|---|---|
| Liberal and Country | Arthur Rylah | 14,152 | 71.6 | ||
| Labor | Norman Williams | 4,883 | 24.7 | ||
| Communist | Ralph Gibson | 731 | 3.7 | ||
| Total formal votes | 19,766 | 98.0 | |||
| Informal votes | 401 | 2.0 | |||
| Turnout | 20,167 | 91.4 | |||
| Two-party-preferred result | |||||
| Liberal and Country | Arthur Rylah | 14,225 | 72.0 | ||
| Labor | Norman Williams | 5,541 | 28.0 | ||
| Liberal and Country hold | Swing | ||||
| Party | Candidate | Votes | % | ±% | |
|---|---|---|---|---|---|
| Liberal and Country | Arthur Rylah | 7,780 | 37.4 | -62.6 | |
| Labor | Norman Williams | 6,696 | 32.2 | +32.2 | |
| Electoral Reform | John Eddy | 6,303 | 30.3 | +30.3 | |
| Total formal votes | 20,779 | 98.0 | |||
| Informal votes | 418 | 2.0 | |||
| Turnout | 21,197 | 93.3 | |||
| Two-party-preferred result | |||||
| Liberal and Country | Arthur Rylah | 13,076 | 62.9 | -37.1 | |
| Labor | Norman Williams | 7,703 | 37.1 | +37.1 | |
| Liberal and Country hold | Swing | N/A | |||
| Party | Candidate | Votes | % | ±% | |
|---|---|---|---|---|---|
| Liberal and Country | Arthur Rylah | unopposed | |||
| Liberal and Country hold | Swing | ||||
Elections in the 1940s
| Party | Candidate | Votes | % | ±% | |
|---|---|---|---|---|---|
| Liberal and Country | Arthur Rylah | 14,480 | 74.8 | +3.7 | |
| Independent | Thomas Fynmore | 4,888 | 25.2 | +25.2 | |
| Total formal votes | 19,368 | 95.5 | -3.6 | ||
| Informal votes | 912 | 4.5 | +3.6 | ||
| Turnout | 20,280 | 83.6 | -6.4 | ||
| Liberal and Country hold | Swing | N/A | |||
| Party | Candidate | Votes | % | ±% | |
|---|---|---|---|---|---|
| Liberal | Wilfrid Kent Hughes | 16,528 | 71.2 | -28.8 | |
| Labor | Rupert Purchase | 6,694 | 28.8 | +28.8 | |
| Total formal votes | 23,222 | 99.1 | |||
| Informal votes | 204 | 0.9 | |||
| Turnout | 23,426 | 90.0 | |||
| Liberal hold | Swing | N/A | |||
| Party | Candidate | Votes | % | ±% | |
|---|---|---|---|---|---|
| Liberal | Wilfrid Kent Hughes | unopposed | |||
| Liberal hold | Swing | ||||
| Party | Candidate | Votes | % | ±% | |
|---|---|---|---|---|---|
| United Australia | Wilfrid Kent Hughes | unopposed | |||
| United Australia hold | Swing | ||||
| Party | Candidate | Votes | % | ±% | |
|---|---|---|---|---|---|
| United Australia | Wilfrid Hughes | 18,496 | 68.0 | -0.1 | |
| Labor | Arthur Kyle | 8,716 | 32.0 | +0.1 | |
| Total formal votes | 27,212 | 98.8 | 0.0 | ||
| Informal votes | 321 | 1.2 | 0.0 | ||
| Turnout | 27,533 | 92.8 | +0.8 | ||
| United Australia hold | Swing | -0.1 | |||
Elections in the 1930s
| Party | Candidate | Votes | % | ±% | |
|---|---|---|---|---|---|
| United Australia | Wilfrid Hughes | 17,053 | 68.1 | +2.2 | |
| Labor | Arthur Kyle | 8,002 | 31.9 | -2.2 | |
| Total formal votes | 25,055 | 98.8 | +0.1 | ||
| Informal votes | 315 | 1.2 | -0.1 | ||
| Turnout | 25,370 | 92.0 | -1.5 | ||
| United Australia hold | Swing | +2.2 | |||
| Party | Candidate | Votes | % | ±% | |
|---|---|---|---|---|---|
| United Australia | Wilfrid Hughes | 15,641 | 65.9 | -11.4 | |
| Labor | Thomas Botsman | 8,090 | 34.1 | +11.4 | |
| Total formal votes | 23,731 | 98.7 | -0.2 | ||
| Informal votes | 305 | 1.3 | +0.2 | ||
| Turnout | 24,036 | 93.5 | +1.4 | ||
| United Australia hold | Swing | -11.4 | |||
| Party | Candidate | Votes | % | ±% | |
|---|---|---|---|---|---|
| United Australia | Kent Hughes | 17,566 | 77.3 | +15.3 | |
| Labor | Thomas Mottram | 5,148 | 22.7 | -8.8 | |
| Total formal votes | 22,714 | 98.9 | +0.3 | ||
| Informal votes | 263 | 1.1 | -0.3 | ||
| Turnout | 22,977 | 92.1 | -1.2 | ||
| United Australia hold | Swing | +11.6 | |||
Elections in the 1920s
| Party | Candidate | Votes | % | ±% | |
|---|---|---|---|---|---|
| Nationalist | Kent Hughes | 13,551 | 62.0 | +29.7 | |
| Labor | Cyril Murphy | 6,889 | 31.5 | +6.7 | |
| Independent | Constantine Crowley | 1,399 | 6.4 | +6.4 | |
| Total formal votes | 21,839 | 98.6 | +1.0 | ||
| Informal votes | 304 | 1.4 | -1.0 | ||
| Turnout | 22,143 | 93.3 | +0.2 | ||
| Two-party-preferred result | |||||
| Nationalist | Kent Hughes | 65.7 | +21.5 | ||
| Labor | Cyril Murphy | 34.3 | +34.3 | ||
| Nationalist gain from Ind. Nationalist | Swing | N/A | |||
- Two party preferred vote was estimated.
| Party | Candidate | Votes | % | ±% | |
|---|---|---|---|---|---|
| Nationalist | Edward Reynolds | 6,346 | 32.3 | ||
| Labor | Frederick Riley | 4,877 | 24.8 | ||
| Independent | Wilfred Hughes | 4,727 | 24.1 | ||
| Australian Liberal | William Clark | 3,696 | 18.8 | ||
| Total formal votes | 19,646 | 97.6 | |||
| Informal votes | 475 | 2.4 | |||
| Turnout | 20,121 | 93.1 | |||
| Two-candidate-preferred result | |||||
| Independent | Wilfred Hughes | 10,964 | 55.8 | ||
| Nationalist | Edward Reynolds | 8,682 | 44.2 | ||
| Independent gain from Nationalist | Swing | ||||
References
- "Kew District results". Victorian Electoral Commission. Archived from the original on 6 October 2011. Retrieved 21 November 2011.
- ↑ "Sir Wilfrid Selwyn Kent Hughes". Re-Member: a database of all Victorian MPs since 1851. Parliament of Victoria. 28 August 2019. Archived from the original on 23 April 2023.
- ↑ "Sir Arthur Gordon Rylah (CBE KMG)". Re-Member: a database of all Victorian MPs since 1851. Parliament of Victoria. 28 August 2019. Archived from the original on 23 April 2023.
- ↑ "Sir Rupert James Hamer (KCMG)". Re-Member: a database of all Victorian MPs since 1851. Parliament of Victoria. 28 August 2019. Archived from the original on 23 April 2023.
- ↑ "Prudence Anne Sibree". Re-Member: a database of all Victorian MPs since 1851. Parliament of Victoria. 20 February 2019. Archived from the original on 23 April 2023.
- ↑ "Jan Louise Murray Wade". Re-Member: a database of all Victorian MPs since 1851. Parliament of Victoria. 20 November 2018. Archived from the original on 23 April 2023.
- ↑ "Andrew McIntosh". Re-Member: a database of all Victorian MPs since 1851. Parliament of Victoria. 20 November 2018. Archived from the original on 23 April 2023.
- ↑ "Mr Timothy Colin Smith". Re-Member: a database of all Victorian MPs since 1851. Parliament of Victoria. 14 December 2022. Archived from the original on 23 April 2023.
- ↑ Green, Antony (11 January 2023). "VIC22 – 2-Party Preferred Results and Swings by District". Antony Green's Election Blog. Retrieved 28 January 2023.
- ↑ VIC 2021 Final Redistribution, ABC News. [Retrieved 1 January 2023.
- ↑ "Kew District results". Victorian Electoral Commission. Retrieved 1 December 2022.
- ↑ State Election 2018: Kew District, VEC.
- ↑ Statistics for the General Election Held on Saturday, 1 October 1988. Victoria: Government Printer. 1988.
- ↑ Carr, Adam. "The Forty-ffifth Parliament Elected 30 May 1970". Adam Carr's Election Archive. Archived from the original on 19 April 2021. Retrieved 31 December 2022.
This article is issued from Wikipedia. The text is licensed under Creative Commons - Attribution - Sharealike. Additional terms may apply for the media files.