| Province-level divisions of China by: |
|---|
This is a list of the first-level administrative divisions of the People's Republic of China (P.R.C.), including all provinces, autonomous regions, special administrative regions and municipalities, in order of their life expectancy in 2021.[1][2]

Life Expectancy by Chinese Administrative Division in 2019.
85.0 and Over
82.0-84.99
79.0-81.99
76.0-78.99
73.0-75.99
70.0-72.99
69.99 and Below

Development of life expectancy in China according to estimation of the World Bank Group
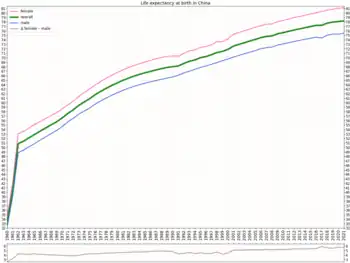
Life expectancy with calculated gender gap

Life expectancy in China in comparison to leader of the country

Life expectancy in China according to estimation of
the Our World in Data
the Our World in Data

Development of life expectancy in China in comparison to the USA and Russia
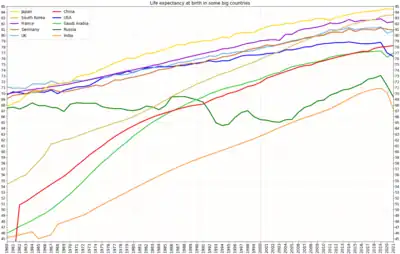
Development of life expectancy in China in comparison to other big countries of the world
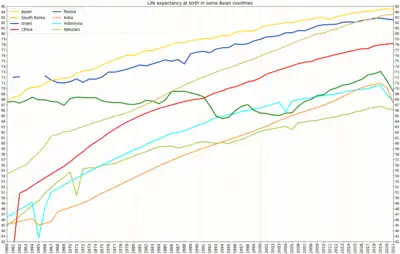
Development of life expectancy in China in comparison to other big countries of Asia
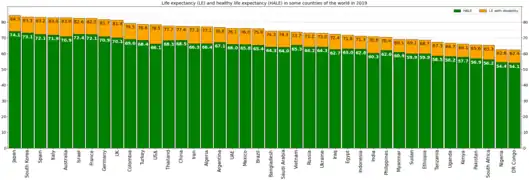
Life expectancy and healthy life expectancy in China on the background of other countries of the world in 2019
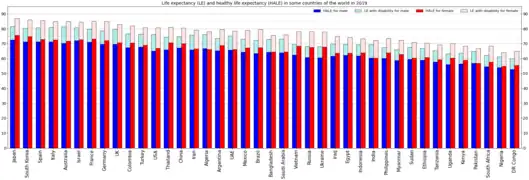
Life expectancy and healthy life expectancy for males and females
| Rank | Name | Life expectancy |
|---|---|---|
| 1 | Hong Kong | 85.49 |
| 2 | Macau | 85.40 |
| 3 | Shanghai | 83.43 |
| 4 | Beijing | 83.34 |
| 5 | Tianjin | 82.00 |
| 6 | Zhejiang | 80.80 |
| 7 | Jiangsu | 79.65 |
| 8 | Guangdong | 79.51 |
| 9 | Shandong | 79.48 |
| 10 | Liaoning | 79.39 |
| 11 | Hainan | 79.31 |
| 12 | Jilin | 79.19 |
| 13 | Heilongjiang | 78.98 |
| 14 | Fujian | 78.75 |
| 15 | Chongqing | 78.69 |
| 16 | Guangxi | 78.07 |
| 17 | Anhui | 78.04 |
| 18 | Hebei | 77.93 |
| 19 | Shanxi | 77.88 |
| 20 | Hubei | 77.82 |
| 21 | Sichuan | 77.70 |
| 22 | Hunan | 77.65 |
| 23 | Shaanxi | 77.63 |
| 24 | Henan | 77.51 |
| 25 | Inner Mongolia | 77.38 |
| 26 | Jiangxi | 77.26 |
| 27 | Ningxia | 76.28 |
| 28 | Xinjiang | 75.21 |
| 29 | Gansu | 75.08 |
| 30 | Guizhou | 73.91 |
| 31 | Qinghai | 72.72 |
| 32 | Yunnan | 71.28 |
| 33 | Tibet | 70.86 |
See also
Wikimedia Commons has media related to Life expectancy charts for China.
References
- ↑ "Life expectancy - Subnational HDI - Global Data Lab". globaldatalab.org. Retrieved 28 June 2021.
- ↑ "Life expectancy at birth, total (years) - Hong Kong SAR, China, Macao SAR, China | Data". data.worldbank.org. Retrieved 28 June 2021.
- National Bureau of Statistics of the People's Republic of China
- The World FactBook
- List of Chinese cities by life expectancy
This article is issued from Wikipedia. The text is licensed under Creative Commons - Attribution - Sharealike. Additional terms may apply for the media files.