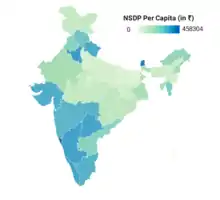
NSDP Per Capita of Indian states and Union Territoriess, 2018–2019
This is a list of Indian states and union territories by NSDP per capita. Net state domestic product (NSDP) is the state counterpart to a country's Net domestic product (NDP), which equals the gross domestic product (GDP) minus depreciation on a country's capital goods. The following table gives the latest available nominal NSDP per capita figures for the States and union territories of India at current prices in Indian rupees. No data is available for the union territories of Dadra and Nagar Haveli and Daman and Diu and Ladakh.
List
| Rank | State/Union Territory | 2021-22 (INR) | 2021-2022 (USD) | 2021-2022 (USD in PPP terms) |
|---|---|---|---|---|
| 1 | Goa | ₹ 4,72,070 | $ 6,215 | $ 20,148 |
| 2 | Sikkim | ₹ 4,63,509 | $ 6,102 | $ 19,783 |
| 3 | Delhi | ₹ 3,89,529 | $ 5,128 | $ 16,625 |
| 4 | Chandigarh | ₹ 3,33,932 | $ 4,396 | $ 14,252 |
| 5 | Telangana | ₹ 2,70,839 | $ 3,566 | $ 11,559 |
| 6 | Karnataka | ₹ 2,65,623 | $ 3,497 | $ 11,337 |
| 7 | Haryana | ₹ 2,64,835 | $ 3,487 | $ 11,303 |
| 8 | Puducherry | ₹ 2,51,344 | $ 3,309 | $ 10,727 |
| 9 | Tamil Nadu | ₹ 2,42,253 | $ 3,189 | $ 10,339 |
| 10 | Gujarat | ₹ 2,41,930 | $ 3,185 | $ 10,326 |
| 11 | Kerala | ₹ 2,33,855 | $ 3,079 | $ 9,981 |
| 12 | Andaman and Nicobar Islands | ₹ 2,29,080 | $ 3,016 | $ 9,777 |
| 13 | Maharashtra | ₹ 2,15,233 | $ 2,834 | $ 9,186 |
| 14 | Uttarakhand | ₹ 2,11,657 | $ 2,786 | $ 9,034 |
| 15 | Arunachal Pradesh | ₹ 2,05,645 | $ 2,707 | $ 8,777 |
| 16 | Himachal Pradesh | ₹ 2,01,271 | $ 2,650 | $ 8,590 |
| 17 | Mizoram | ₹ 1,98,962 | $ 2,619 | $ 8,492 |
| 18 | Andhra Pradesh | ₹ 1,92,587 | $ 2,535 | $ 8,220 |
| 19 | Punjab | ₹ 1,68,705 | $ 2,221 | $ 7,200 |
| - | India | ₹ 1,48,524 | $ 1,955 | $ 6,339 |
| 20 | Tripura | ₹ 1,37,472 | $ 1,810 | $ 5,867 |
| 21 | Rajasthan | ₹ 1,35,962 | $ 1,790 | $ 5,803 |
| 22 | Odisha | ₹ 1,28,181 | $ 1,687 | $ 5,471 |
| 23 | Nagaland | ₹ 1,25,887 | $ 1,657 | $ 5,373 |
| 24 | West Bengal | ₹ 1,24,798 | $ 1,643 | $ 5,326 |
| 25 | Madhya Pradesh | ₹ 1,21,594 | $ 1,601 | $ 5,190 |
| 26 | Jammu and Kashmir | ₹ 1,20,790 | $ 1,590 | $ 5,155 |
| 27 | Chhattisgarh | ₹ 1,20,704 | $ 1,589 | $ 5,152 |
| 28 | Meghalaya | ₹ 1,03,335 | $ 1,360 | $ 4,410 |
| 29 | Assam | ₹ 1,02,965 | $ 1,356 | $ 4,395 |
| 30 | Manipur | ₹ 91,560 | $ 1,205 | $ 3,908 |
| 31 | Jharkhand | ₹ 84,059 | $ 1,107 | $ 3,588 |
| 32 | Uttar Pradesh | ₹ 73,048 | $ 962 | $ 3,118 |
| 33 | Bihar | ₹ 47,498 | $ 625 | $ 2,027 |
Past NSDP per capita of Indian states
No data is available for the union territories of Dadra and Nagar Haveli, Daman and Diu and Lakshadweep.
| Rank | State/Union territory | NSDP Per Capita (Nominal) 2011–12[2][3] | NSDP Per Capita (Nominal) 2012–13[2] | NSDP Per Capita (Nominal) 2013–14[2] | NSDP Per Capita (Nominal) 2014–15[2] | NSDP Per Capita (Nominal) 2015–16[2] | NSDP Per Capita (Nominal) 2016–17[2] | NSDP Per Capita (Nominal) 2017–18[2] | NSDP Per Capita (Nominal) 2018–19[2] | NSDP Per Capita (Nominal) 2020–21[4] | NSDP Per Capita (Nominal) 2021–22[4] | NSDP Per Capita (Nominal) 2022–23[4] |
|---|---|---|---|---|---|---|---|---|---|---|---|---|
| 1 | Sikkim | ₹ 1,58,667 | ₹ 1,74,183 | ₹ 1,94,624 | ₹ 2,14,148 | ₹ 2,45,987 | ₹ 2,80,729 | ₹ 3,17,134 | ₹ 3,57,643 | ₹ 4,12,754 | ₹ 4,72,543 | N/A |
| 2 | Goa | ₹ 2,59,444 | ₹ 2,34,354 | ₹ 2,15,776 | ₹ 2,89,185 | ₹ 3,34,575 | ₹ 3,82,140 | ₹ 4,22,155 | ₹ 4,58,304 | ₹ 4,31,351 | ₹ 4,72,070 | N/A |
| 3 | Delhi | ₹ 2,29,619 | ₹ 2,49,589 | ₹ 2,73,301 | ₹ 2,98,832 | ₹ 3,28,985 | ₹ 2,98,832 | ₹ 3,28,985 | ₹ 3,65,529 | ₹ 3,31,112 | ₹ 3,89,529 | N/A |
| 4 | Chandigarh | ₹ 1,59,116 | ₹ 1,80,624 | ₹ 2,04,542 | ₹ 2,12,786 | ₹ 2,30,417 | ₹ 2,54,263 | ₹ 2,96,434 | ₹ 3,29,209 | ₹ 2,91,194 | ₹ 3,49,373 | N/A |
| 5 | Telangana | ₹ 92,984 | ₹ 1,04,943 | ₹ 1,16,236 | ₹ 1,28,372 | ₹ 1,40,441 | ₹ 1,54,272 | ₹ 1,71,583 | ₹ 1,93,750 | ₹ 2,25,687 | ₹ 2,65,942 | ₹ 3,08,732 |
| 6 | Karnataka | ₹ 90,269 | ₹ 1,02,314 | ₹ 1,18,829 | ₹ 1,30,024 | ₹ 1,48,108 | ₹ 1,70,133 | ₹ 1,87,649 | ₹ 2,10,887 | ₹ 2,21,310 | ₹ 2,65,623 | ₹ 3,01,673 |
| 7 | Haryana | ₹ 1,06,085 | ₹ 1,21,169 | ₹ 1,37,770 | ₹ 1,47,382 | ₹ 1,64,963 | ₹ 1,85,050 | ₹ 2,11,526 | ₹ 2,36,147 | ₹ 2,29,065 | ₹ 2,64,835 | ₹ 2,96,685 |
| 8 | Tamil Nadu | ₹ 91,121 | ₹ 1,01,007 | ₹ 1,12,162 | ₹ 1,24,104 | ₹ 1,40,840 | ₹ 1,59,395 | ₹ 1,80,494 | ₹ 2,04,488 | ₹ 2,12,174 | ₹ 2,41,131 | ₹ 2,73,288 |
| 9 | Gujarat | ₹ 87,481 | ₹ 1,02,826 | ₹ 1,13,139 | ₹ 1,27,017 | ₹ 1,39,254 | ₹ 1,56,295 | ₹ 1,73,079 | ₹ 1,97,447 | ₹ 2,12,821 | ₹ 2,50,100 | N/A |
| 10 | Maharastra | ₹ 99,564 | ₹ 1,11,980 | ₹ 1,25,035 | ₹ 1,32,476 | ₹ 1,46,258 | ₹ 1,62,005 | ₹ 1,76,102 | ₹ 1,91,736 | ₹ 1,83,704 | ₹ 2,15,233 | ₹ 2,42,247 |
| 11 | Uttarakhand | ₹ 1,00,305 | ₹ 1,13,610 | ₹ 1,26,247 | ₹ 1,35,881 | ₹ 1,47,592 | ₹ 1,61,172 | ₹ 1,82,320 | ₹ 1,98,738 | ₹ 1,84,002 | ₹ 2,11,657 | ₹ 2,33,565 |
| 12 | Kerala | ₹ 97,912 | ₹ 1,10,314 | ₹ 1,23,321 | ₹ 1,35,517 | ₹ 1,48,133 | ₹ 1,66,205 | ₹ 1,83,435 | ₹ 2,04,105 | ₹ 1,94,322 | ₹ 2,28,767 | N/A |
| 13 | Andhra Pradesh | ₹ 69,000 | ₹ 74,687 | ₹ 82,870 | ₹ 93,903 | ₹ 1,08,002 | ₹ 1,20,676 | ₹ 1,39,680 | ₹ 1,51,173 | ₹ 1,63,746 | ₹ 1,92,587 | ₹ 2,19,518 |
| 14 | Arunachal Pradesh | ₹ 73,068 | ₹ 81,353 | ₹ 91,809 | ₹ 1,10,929 | ₹ 1,12,046 | ₹ 1,17,344 | ₹ 1,30,197 | ₹ 1,39,588 | ₹ 1,90,212 | ₹ 2,15,897 | N/A |
| 15 | Puducherry | ₹ 1,19,649 | ₹ 1,30,548 | ₹ 1,48,147 | ₹ 1,46,921 | ₹ 1,72,727 | ₹ 1,87,357 | ₹ 2,03,583 | ₹ 2,20,461 | ₹ 2,03,178 | ₹ 2,09,890 | N/A |
| 16 | Himachal Pradesh | ₹ 87,721 | ₹ 99,730 | ₹ 1,14,095 | ₹ 1,23,299 | ₹ 1,35,512 | ₹ 1,50,290 | ₹ 1,67,044 | ₹ 1,79,188 | ₹ 1,83,333 | ₹ 2,01,854 | N/A |
| 17 | Andaman and Nicobar Islands | ₹ 88,177 | ₹ 96,027 | ₹ 1,06,401 | ₹ 1,19,291 | ₹ 1,26,995 | ₹ 1,40,335 | ₹ 1,59,664 | N/A | ₹ 1,97,275 | N/A | N/A |
| 18 | Mizoram | ₹ 57,654 | ₹ 65,013 | ₹ 77,583 | ₹ 1,03,049 | ₹ 1,14,055 | ₹ 1,27,107 | ₹ 1,46,765 | ₹ 1,68,626 | ₹ 1,87,838 | ₹ 1,88,839 | N/A |
| 19 | Punjab | ₹ 85,577 | ₹ 94,318 | ₹ 1,03,381 | ₹ 1,08,970 | ₹ 1,18,558 | ₹ 1,28,780 | ₹ 1,42,477 | ₹ 1,54,996 | ₹ 1,49,193 | ₹ 1,61,888 | ₹ 1,73,873 |
| 20 | Rajasthan | ₹ 57,192 | ₹ 63,658 | ₹ 69,480 | ₹ 76,429 | ₹ 83,426 | ₹ 91,946 | ₹ 99,366 | ₹ 1,10,606 | ₹ 1,15,122 | ₹ 1,35,962 | ₹ 1,56,149 |
| 21 | Odisha | ₹ 48,370 | ₹ 54,703 | ₹ 60,574 | ₹ 63,169 | ₹ 64,595 | ₹ 77,255 | ₹ 84,496 | ₹ 95,164 | ₹ 1,02,166 | ₹ 1,28,873 | ₹ 1,50,676 |
| 22 | Nagaland | ₹ 53,010 | ₹ 61,225 | ₹ 71,510 | ₹ 78,367 | ₹ 82,466 | ₹ 92,315 | ₹ 1,04,681 | ₹ 1,16,882 | ₹ 1,26,452 | ₹ 1,42,363 | N/A |
| 23 | West Bengal | ₹ 51,543 | ₹ 58,195 | ₹ 65,932 | ₹ 68,876 | ₹ 75,592 | ₹ 82,291 | ₹ 93,711 | ₹ 1,09,491 | ₹ 1,06,510 | ₹ 1,24,798 | ₹ 1,41,373 |
| 24 | Tripura | ₹ 47,079 | ₹ 52,434 | ₹ 61,570 | ₹ 69,474 | ₹ 83,680 | ₹ 90,827 | ₹ 1,00,477 | ₹ 1,13,102 | ₹ 1,19,789 | ₹ 1,40,803 | N/A |
| 25 | Madhya Pradesh | ₹ 38,551 | ₹ 44,931 | ₹ 52,169 | ₹ 56,069 | ₹ 62,626 | ₹ 74,787 | ₹ 82,941 | ₹ 90,998 | ₹ 1,03,654 | ₹ 1,21,594 | ₹ 1,40,583 |
| 26 | Chhattisgarh | ₹ 55,177 | ₹ 60,849 | ₹ 69,880 | ₹ 72,936 | ₹ 73,590 | ₹ 81,808 | ₹ 89,813 | ₹ 96,887 | ₹ 1,04,788 | ₹ 1,20,704 | ₹ 1,33,898 |
| 27 | Jammu and Kashmir | ₹ 53,173 | ₹ 56,828 | ₹ 61,108 | ₹ 61,211 | ₹ 73,215 | ₹ 77,023 | ₹ 82,710 | ₹ 91,882 | ₹ 1,02,803 | ₹ 1,16,619 | ₹ 1,32,806 |
| 28 | Assam | ₹ 41,142 | ₹ 44,599 | ₹ 49,734 | ₹ 52,895 | ₹ 60,817 | ₹ 66,330 | ₹ 74,184 | ₹ 82,078 | ₹ 90,482 | ₹ 1,02,965 | ₹ 1,18,504 |
| 29 | Meghalaya | ₹ 60,013 | ₹ 64,036 | ₹ 65,118 | ₹ 64,638 | ₹ 68,836 | ₹ 73,753 | ₹ 81,098 | ₹ 89,024 | ₹ 84,638 | ₹ 90,638 | ₹ 98,572 |
| 30 | Manipur | ₹ 39,762 | ₹ 41,230 | ₹ 47,798 | ₹ 52,717 | ₹ 55,447 | ₹ 59,345 | ₹ 65,008 | ₹ 69,978 | ₹ 79,797 | ₹ 84,345 | NA |
| 31 | Jharkhand | ₹ 41,254 | ₹ 47,360 | ₹ 50,006 | ₹ 57,301 | ₹ 52,754 | ₹ 60,018 | ₹ 69,265 | ₹ 76,019 | ₹ 71,071 | ₹ 78,660 | N/A |
| 32 | Uttar Pradesh | ₹ 32,002 | ₹ 35,812 | ₹ 40,124 | ₹ 42,267 | ₹ 47,118 | ₹ 52,744 | ₹ 58,821 | ₹ 66,512 | ₹ 61,374 | ₹ 70,792 | N/A |
| 33 | Bihar | ₹ 21,750 | ₹ 24,487 | ₹ 26,948 | ₹ 28,671 | ₹ 30,404 | ₹ 34,156 | ₹ 38,631 | ₹ 43,822 | ₹ 43,605 | ₹ 49,470 | N/A |
Historical NSDP per capita of Indian states
No data is available for the union territories of Dadra and Nagar Haveli, Daman and Diu and Lakshadweep.
| Rank | State/Union territory | NSDP Per Capita (Nominal) 1996–97[3] | NSDP Per Capita (Nominal) 2000–01[3] | NSDP Per Capita (Nominal) 2005–06[3] | NSDP Per Capita (Nominal) 2010–11[3] | Growth from 2000 to 2010 |
|---|---|---|---|---|---|---|
| 1 | Goa | ₹ 26,418 | ₹ 43,735 | ₹ 84,721 | ₹ 1,68,024 | 284% |
| 2 | Delhi | ₹ 25,952 | ₹ 40,678 | ₹ 72,208 | ₹ 1,45,129 | 256% |
| 3 | Sikkim | ₹ 11,332 | ₹ 16,077 | ₹ 30,252 | ₹ 1,08,972 | 577% |
| 4 | Chandigarh | ₹ 31,158 | ₹ 49,771 | ₹ 84,993 | ₹ 1,26,651 | 154% |
| 5 | Haryana | ₹ 16,611 | ₹ 25,583 | ₹ 42,309 | ₹ 93,852 | 266% |
| 6 | Puducherry | ₹ 18,631 | ₹ 35,994 | ₹ 67,205 | ₹ 1,01,072 | 180% |
| 7 | Tamil Nadu | ₹ 11,670 | ₹ 18,344 | ₹ 31,239 | ₹ 62,251 | 240% |
| 8 | Karnataka | ₹ 11,202 | ₹ 17,195 | ₹ 28,987 | ₹ 66,951 | 289% |
| 9 | Kerala | ₹ 13,280 | ₹ 20,094 | ₹ 36,958 | ₹ 69,943 | 248% |
| 10 | Uttarakhand | ₹ 9,334 | ₹ 15,285 | ₹ 29,441 | ₹ 73,819 | 446% |
| 11 | Gujarat | ₹ 16,153 | ₹ 18,392 | ₹ 37,780 | ₹ 77,485 | 321% |
| 12 | Telangana | ₹ 13,269 | ₹ 20,972 | ₹ 35,243 | ₹ 78,473 | 274% |
| 13 | Maharashtra | ₹ 17,844 | ₹ 22,777 | ₹ 41,965 | ₹ 84,858 | 375% |
| 14 | Himachal Pradesh | ₹ 11,960 | ₹ 22,795 | ₹ 36,949 | ₹ 68,297 | 200% |
| 15 | Andaman and Nicobar Islands | ₹ 21,017 | ₹ 25,047 | ₹ 44,754 | ₹ 80,558 | 283% |
| 16 | Mizoram | ₹ 12,210 | ₹ 17,826 | ₹ 26,698 | ₹ 50,956 | 195% |
| 17 | Punjab | ₹ 17,353 | ₹ 27,881 | ₹ 36,199 | ₹ 69,582 | 149% |
| 18 | Andhra Pradesh | ₹ 11,202 | ₹ 17,195 | ₹ 28,223 | ₹ 58,733 | 241% |
| 19 | Arunachal Pradesh | ₹ 10,816 | ₹ 15,260 | ₹ 28,171 | ₹ 60,961 | 299% |
| 20 | Nagaland | ₹ 11,805 | ₹ 16,253 | ₹ 33,792 | ₹ 55,582 | 241% |
| 21 | Tripura | ₹ 8,109 | ₹ 15,983 | ₹ 26,668 | ₹ 46,050 | 188% |
| 22 | Rajasthan | ₹ 10,102 | ₹ 13,020 | ₹ 20,275 | ₹ 44,644 | 242% |
| 23 | West Bengal | ₹ 9,857 | ₹ 16,583 | ₹ 24,720 | ₹ 47,245 | 184% |
| 24 | Chhattisgarh | ₹ 8,353 | ₹ 10,744 | ₹ 20,117 | ₹ 41,165 | 283% |
| 25 | Odisha | ₹ 6,548 | ₹ 10,453 | ₹ 18,846 | ₹ 39,537 | 278% |
| 26 | Jammu and Kashmir | ₹ 8,667 | ₹ 14,268 | ₹ 23,240 | ₹ 40,089 | 180% |
| 27 | Madhya Pradesh | ₹ 8,819 | ₹ 11,862 | ₹ 16,631 | ₹ 32,453 | 173% |
| 28 | Meghalaya | ₹ 9,243 | ₹ 15,657 | ₹ 24,885 | ₹ 43,766 | 179% |
| 29 | Assam | ₹ 7,394 | ₹ 12,803 | ₹ 18,396 | ₹ 33,087 | 158% |
| 30 | Jharkhand | ₹ 7,235 | ₹ 10,345 | ₹ 18,326 | ₹ 34,721 | 235% |
| 31 | Manipur | ₹ 7,920 | ₹ 12,369 | ₹ 20,251 | ₹ 28,336 | 130% |
| 32 | Uttar Pradesh | ₹ 7,476 | ₹ 9,828 | ₹ 14,221 | ₹ 26,698 | 171% |
| 33 | Bihar | ₹ 4,001 | ₹ 6,415 | ₹ 8,223 | ₹ 19,111 | 197% |
Notes
References
- ↑ "Table 9, Handbook of Statistics on the Indian Economy, 2022-23, Reserve Bank of India". Retrieved 15 September 2023.
- 1 2 3 4 5 6 7 8 "MOSPI State Domestic Product, Ministry of Statistics and Programme Implementation, Government of India". 15 March 2021. Retrieved 28 March 2021.
- 1 2 3 4 5 "Handbook of Statistics, Reserve Bank of India – Publications". www.rbi.org.in. Retrieved 7 April 2020.
- 1 2 3 "State-wise Data on Per Capita Income, Press Information Bureau, Ministry of Statistics and Programme Implementation, Government of India". 24 July 2023. Retrieved 24 July 2023.
This article is issued from Wikipedia. The text is licensed under Creative Commons - Attribution - Sharealike. Additional terms may apply for the media files.