The following is the list of Mexico's 32 federal states ranked by their GDP (PPP) per capita as of 2018, according to OECD Statistics.[1]
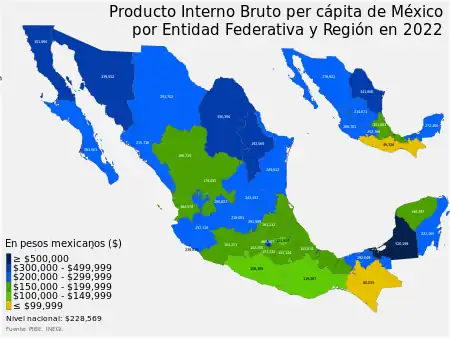
PPP GDP per capita of Mexican states, US$, 2020
| Mexican States by GDP (PPP) per capita - 2018 | ||||
|---|---|---|---|---|
| Rank | State | PPP per capita (MXN) | PPP per capita (USD) | |
| 1 | 613,639 | 67,233 | ||
| 2 | 437,405 | 47,924 | ||
| 3 | 338,655 | 37,105 | ||
| 4 | 295,875 | 32,418 | ||
| 5 | 289,002 | 31,665 | ||
| 6 | 266,775 | 29,229 | ||
| 7 | 260,071 | 28,495 | ||
| 8 | 247,577 | 27,126 | ||
| 9 | 219,011 | 23,996 | ||
| 10 | 216,675 | 23,740 | ||
| 11 | 212,886 | 23,325 | ||
| 12 | 207,980 | 22,787 | ||
| 13 | 203,407 | 22,286 | ||
| 14 | 193,594 | 21,211 | ||
| 15 | 188,815 | 20,688 | ||
| 16 | 188,482 | 20,651 | ||
| 17 | 173,992 | 19,063 | ||
| 18 | 169,522 | 18,574 | ||
| 19 | 157,425 | 17,248 | ||
| 20 | 150,109 | 16,447 | ||
| 21 | 132,803 | 14,551 | ||
| 22 | 132,627 | 14,531 | ||
| 23 | 132,335 | 14,499 | ||
| 24 | 129,599 | 14,200 | ||
| 25 | 126,830 | 13,896 | ||
| 26 | 126,778 | 13,890 | ||
| 27 | 126,310 | 13,839 | ||
| 28 | 117,794 | 12,906 | ||
| 29 | 100,882 | 11,053 | ||
| 30 | 91,232 | 9,996 | ||
| 31 | 89,533 | 9,810 | ||
| 32 | 66,216 | 7,255 | ||
| - | 188,327 | 20,634 | ||
See also
General:
References
- ↑ "Regional Economy: Gross Domestic Product, Large Regions". OECD Statistics. Retrieved 2021-01-26.
This article is issued from Wikipedia. The text is licensed under Creative Commons - Attribution - Sharealike. Additional terms may apply for the media files.