
Map of Japanese prefectures by life expectancy (2015)

Development of life expectancy in Japan according to estimation of the World Bank Group

Life expectancy with calculated gender gap
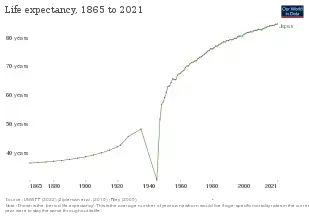
Life expectancy in Japan according to estimation of
the Our World in Data
the Our World in Data
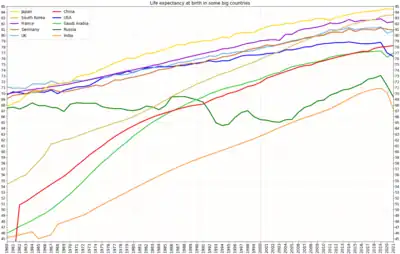
Development of life expectancy in Japan in comparison to other big countries of the world
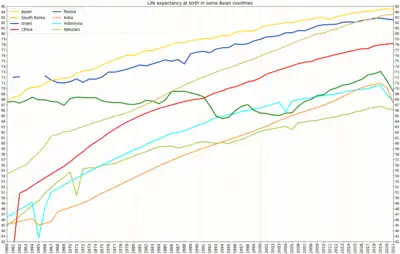
Development of life expectancy in Japan in comparison to other big countries of Asia
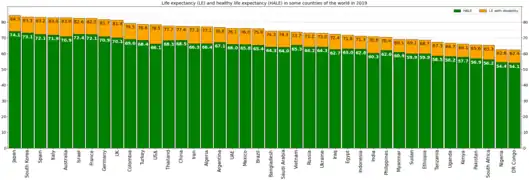
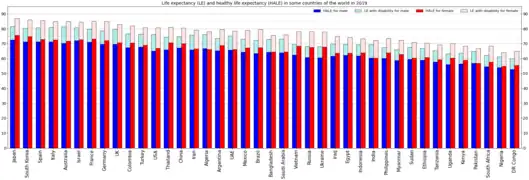
Life expectancy and healthy life expectancy in Japan on the background of other countries of the world in 2019
Life expectancy and healthy life expectancy for males and females
This is a list of Japanese prefectures by life expectancy.[1]
List (2015)
Prefectures by life expectancy at birth according to Ministry of Health, Labour and Welfare of Japan. The total life expectancy is calculated out of the averages for men and women.
| Rank | Prefecture | Life expectancy, total |
Life expectancy, men[2] |
Life expectancy, women[3] |
|---|---|---|---|---|
| 1 | 84.72 | 81.75 | 87.68 | |
| 2 | 84.68 | 81.78 | 87.57 | |
| 3 | 84.41 | 81.27 | 87.54 | |
| 4 | 84.38 | 81.40 | 87.35 | |
| 5 | 84.36 | 81.22 | 87.49 | |
| 6 | 84.35 | 81.03 | 87.67 | |
| 7 | 84.31 | 81.36 | 87.25 | |
| 8 | 84.28 | 81.32 | 87.24 | |
| 9 | 84.22 | 80.79 | 87.64 | |
| 10 | 84.21 | 81.08 | 87.33 | |
| 11 | 84.20 | 81.08 | 87.31 | |
| 12 | 84.17 | 81.07 | 87.26 | |
| 13 | 84.16 | 81.04 | 87.28 | |
| 14 | 84.08 | 80.99 | 87.16 | |
| 15 | 84.04 | 80.85 | 87.22 | |
| 16 | 84.03 | 80.95 | 87.10 | |
| 16 | 84.03 | 80.85 | 87.21 | |
| 18 | 84.02 | 80.61 | 87.42 | |
| 19 | 84.01 | 80.69 | 87.32 | |
| 20 | 84.00 | 80.92 | 87.07 | |
| 21 | 83.98 | 81.10 | 86.86 | |
| 22 | 83.94 | 80.96 | 86.91 | |
| 23 | 83.93 | 80.86 | 86.99 | |
| 24 | 83.91 | 81.00 | 86.82 | |
| 25 | 83.90 | 80.66 | 87.14 | |
| 26 | 83.89 | 80.65 | 87.12 | |
| 27 | 83.86 | 80.27 | 87.44 | |
| 28 | 83.74 | 80.82 | 86.66 | |
| 29 | 83.74 | 80.52 | 86.96 | |
| 30 | 83.73 | 80.61 | 86.84 | |
| 31 | 83.73 | 80.34 | 87.12 | |
| 32 | 83.72 | 80.17 | 87.27 | |
| 33 | 83.70 | 80.51 | 86.88 | |
| 34 | 83.68 | 80.38 | 86.97 | |
| 35 | 83.64 | 80.26 | 87.01 | |
| 36 | 83.53 | 80.28 | 86.77 | |
| 37 | 83.49 | 80.32 | 86.66 | |
| 38 | 83.49 | 80.16 | 86.82 | |
| 39 | 83.48 | 80.23 | 86.73 | |
| 40 | 83.40 | 80.02 | 86.78 | |
| 41 | 83.31 | 80.28 | 86.33 | |
| 42 | 83.26 | 80.12 | 86.40 | |
| 43 | 83.21 | 79.94 | 86.47 | |
| 44 | 83.17 | 80.10 | 86.24 | |
| 45 | 83.15 | 79.86 | 86.44 | |
| 46 | 82.95 | 79.51 | 86.38 | |
| 47 | 82.30 | 78.67 | 85.93 | |
| 83.89 | 80.77 | 87.01 |
See also
Wikimedia Commons has media related to Life expectancy charts for Japan.
References
- ↑ "平成27年都道府県別生命表の概況|厚生労働省". www.mhlw.go.jp. Retrieved 2019-04-19.
- ↑ "Average Life Expectancy: Male".
- ↑ "Average Life Expectancy: Male".
This article is issued from Wikipedia. The text is licensed under Creative Commons - Attribution - Sharealike. Additional terms may apply for the media files.