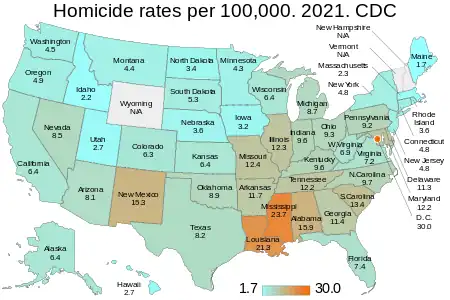
This is a list of U.S. states and territories by intentional homicide rate. It is typically expressed in units of deaths per 100,000 individuals per year; a homicide rate of 4 in a population of 100,000 would mean 4 murders a year, or 0.004% out of the total. The data is from the Centers for Disease Control (CDC),[1] and the Metropolitan Police Department of the District of Columbia.[6]
Definition
In the United States, the law for murder varies by jurisdiction. In many US jurisdictions there is a hierarchy of acts, known collectively as homicide, of which first-degree murder and felony murder are the most serious, followed by second-degree murder and, in a few states, third-degree murder, which in other states is divided into voluntary manslaughter, and involuntary manslaughter such as reckless homicide and negligent homicide, which are the least serious, and ending finally in justifiable homicide, which is not a crime. However, because there are at least 52 relevant jurisdictions, each with its own criminal code, this is a considerable simplification.[7]
Sentencing also varies widely depending upon the specific murder charge. "Life imprisonment" is a common penalty for first-degree murder, but its meaning varies widely.[8]
Capital punishment is a legal sentence in 27 states,[9][10] and in the federal civilian and military legal systems, though 8 of these states and the federal government have indefinitely suspended the practice. The United States is unusual in actually performing executions,[11] with 34 states having performed executions since capital punishment was reinstated in 1976. The methods of execution have varied, but the most common method since 1976 has been lethal injection.[12] In 2019 a total of 22 people were executed,[13] and 2,652 people were on death row.[14]
The federal Unborn Victims of Violence Act, enacted in 2004 and codified at 18 U.S. Code § 1841,[15] allows for a fetus to be treated as victims in crimes. Subsection (c) of that statute specifically prohibits prosecutions related to consented abortions and medical treatments.[15]Table. Rates per 100,000 by year
* indicates "Crime in LOCATION" links.
| State | 2005 | 2014 | 2015 | 2016 | 2017 | 2018 | 2019 | 2020 | 2021 |
|---|---|---|---|---|---|---|---|---|---|
| 9.6 | 8.1 | 10.2 | 11.8 | 12.9 | 12.2 | 12.8 | 14.2 | 15.9 | |
| 5.2 | 4.7 | 8 | 7.3 | 10.6 | 7.5 | 10.8 | 7.3 | 6.4 | |
| 9 | 5 | 5.5 | 6.3 | 6.6 | 6.1 | 5.9 | 7.5 | 8.1 | |
| 8 | 7.7 | 7.4 | 8.7 | 9.8 | 9.1 | 9.4 | 13 | 11.7 | |
| 6.9 | 4.6 | 5 | 5.3 | 5.1 | 4.8 | 4.5 | 6.1 | 6.4 | |
| 3.8 | 3.3 | 3.7 | 4.3 | 4.6 | 4.7 | 4.3 | 5.8 | 6.3 | |
| 3.2 | 2.9 | 3.6 | 2.7 | 3.2 | 2.8 | 3.1 | 4.6 | 4.8 | |
| 6.6 | 6.6 | 7.5 | 7 | 6.9 | 6.8 | 6.1 | 9.9 | 11.3 | |
| 5.8 | 6.2 | 6.3 | 6.8 | 6.4 | 6.6 | 6.7 | 7.8 | 7.4 | |
| 7.1 | 6.6 | 7.3 | 7.9 | 7.9 | 7.7 | 8.1 | 10.5 | 11.4 | |
| 1.9 | 2.2 | 2.2 | 2.8 | 2.5 | 3.1 | 2.5 | 3.3 | 2.7 | |
| 3.2 | 2.4 | 2 | 1.9 | 3 | 2.3 | 1.7 | 2.5 | 2.2 | |
| 6.8 | 6.2 | 6.9 | 9.2 | 9 | 8 | 8.1 | 11.2 | 12.3 | |
| 5.9 | 5.7 | 6 | 7.6 | 7.2 | 7.4 | 7.2 | 9.7 | 9.6 | |
| 1.6 | 2.5 | 2.5 | 2.8 | 3.4 | 2.7 | 2.7 | 3.6 | 3.2 | |
| 3.9 | 3.6 | 4.7 | 5.3 | 6.5 | 5.9 | 4.9 | 7 | 6.4 | |
| 5.4 | 4.7 | 5.8 | 7.2 | 7.3 | 6.1 | 5.9 | 9.5 | 9.6 | |
| 12.8 | 11.7 | 12.4 | 14.3 | 14.4 | 13.3 | 14.7 | 19.9 | 21.3 | |
| 1.7 | 2 | 1.7 | N/A | N/A | N/A | 1.8 | 1.6 | 1.7 | |
| 10.4 | 6.7 | 10.3 | 10.1 | 10.2 | 9.3 | 10 | 11.4 | 12.2 | |
| 2.8 | 2 | 2.1 | 2.1 | 2.6 | 2.3 | 2.3 | 2.7 | 2.3 | |
| 6.9 | 6.3 | 6.4 | 6.7 | 6.3 | 6.5 | 6.5 | 8.7 | 8.7 | |
| 2.7 | 1.9 | 2.8 | 2.4 | 2.2 | 2.3 | 2.8 | 3.6 | 4.3 | |
| 9 | 11.4 | 11.3 | 12.1 | 12.7 | 13.4 | 15.4 | 20.5 | 23.7 | |
| 7.3 | 7.5 | 9.6 | 9.9 | 11.3 | 11.4 | 10.8 | 14 | 12.4 | |
| 3.4 | 2.9 | 4 | 4.3 | 4.3 | 4.2 | 3.7 | 6.6 | 4.4 | |
| 2.5 | 3.4 | 4 | 3.3 | 2.7 | 1.9 | 3.1 | 4.1 | 3.6 | |
| 7.8 | 6.3 | 6.7 | 7.4 | 7.6 | 7.7 | 5.5 | 7.3 | 8.5 | |
| N/A | N/A | N/A | N/A | N/A | 1.8 | 2.8 | N/A | N/A[2] | |
| 5.1 | 4.4 | 4.5 | 4.6 | 4.1 | 3.7 | 3.4 | 4.3 | 4.8 | |
| 7.9 | 6.8 | 8 | 9.4 | 8.5 | 10.8 | 11.8 | 10.8 | 15.3 | |
| 4.7 | 3.4 | 3.4 | 3.6 | 3 | 3.2 | 3.2 | 4.7 | 4.8 | |
| 7.6 | 5.6 | 6.1 | 7.4 | 6.9 | 6.4 | 7 | 8.6 | 9.7 | |
| N/A | N/A | 3.1 | N/A | N/A | 2.5 | 3.1 | 4.4 | 3.4 | |
| 5.6 | 5.2 | 6 | 6.5 | 7.5 | 6.8 | 6.6 | 9.1 | 9.3 | |
| 6.1 | 6.6 | 8.5 | 8.6 | 8.5 | 7 | 8.8 | 9 | 8.9 | |
| 2.9 | 2.4 | 3.4 | 3.3 | 3.1 | 2.5 | 3 | 3.8 | 4.9 | |
| 6.3 | 5.2 | 5.6 | 6 | 6.6 | 6.4 | 6.1 | 8.5 | 9.2 | |
| 3.1 | 2.5 | 2.8 | 2.3 | N/A | N/A | 2.5 | 3 | 3.6 | |
| 7.9 | 7.6 | 9.5 | 9 | 9.3 | 10.2 | 11 | 12.7 | 13.4 | |
| 2.9 | 3.1 | 4.2 | 4.7 | 4.2 | 3.9 | 3.6 | 6.5 | 5.3 | |
| 8.3 | 6.5 | 7.2 | 8.8 | 8.8 | 9.2 | 9.2 | 11.5 | 12.2 | |
| 6.5 | 5.2 | 5.6 | 6 | 5.8 | 5.4 | 5.9 | 7.6 | 8.2 | |
| 2.4 | 2 | 2 | 2.5 | 2.6 | 2.2 | 2.6 | 2.9 | 2.7 | |
| N/A | N/A | N/A | N/A | N/A | N/A | N/A | N/A | N/A[3] | |
| 6.4 | 4.1 | 4.5 | 5.5 | 5.4 | 5.1 | 5.3 | 6.4 | 7.2 | |
| 3.6 | 3.1 | 3.4 | 2.9 | 3.6 | 3.7 | 3.2 | 4.2 | 4.5 | |
| 30.0[5] | |||||||||
| 5.4 | 5.9 | 4.5 | 6.3 | 6.5 | 5.8 | 5.7 | 7 | 6.9 | |
| 4.3 | 3 | 4.5 | 4.8 | 3.7 | 3.9 | 4.2 | 6.1 | 6.4 | |
| N/A | 4.4 | N/A | N/A | N/A | 4.1 | 4.4 | 4.9 | N/A[4] |
Table. Counts by year
All numbers are from the CDC,[1] except for those for Washington, D.C..[6]
| State | 2005 | 2014 | 2015 | 2016 | 2017 | 2018 | 2019 | 2020 | 2021 |
|---|---|---|---|---|---|---|---|---|---|
| Totals | 17,944 | 15,775 | 17,657 | 19,235 | 19,393 | 18,686 | 18,979 | 24,389 | 25,808 |
| 433 | 374 | 473 | 544 | 602 | 568 | 587 | 654 | 748 | |
| 37 | 37 | 62 | 54 | 78 | 56 | 78 | 55 | 49 | |
| 532 | 322 | 364 | 420 | 441 | 420 | 414 | 525 | 562 | |
| 219 | 217 | 217 | 248 | 278 | 264 | 270 | 371 | 335 | |
| 2,540 | 1,813 | 1,987 | 2,074 | 2,022 | 1,890 | 1,794 | 2,368 | 2,495 | |
| 182 | 177 | 206 | 235 | 261 | 263 | 250 | 336 | 368 | |
| 107 | 100 | 124 | 88 | 109 | 92 | 106 | 152 | 160 | |
| 55 | 57 | 65 | 63 | 63 | 57 | 53 | 86 | 103 | |
| 998 | 1,159 | 1,208 | 1,294 | 1,269 | 1,315 | 1,334 | 1,530 | 1,468 | |
| 649 | 658 | 738 | 806 | 810 | 794 | 849 | 1,093 | 1,206 | |
| 25 | 30 | 31 | 39 | 35 | 40 | 35 | 46 | 39 | |
| 45 | 36 | 33 | 30 | 50 | 41 | 27 | 42 | 41 | |
| 866 | 792 | 863 | 1,157 | 1,120 | 994 | 979 | 1,353 | 1,487 | |
| 368 | 364 | 389 | 480 | 456 | 473 | 466 | 620 | 624 | |
| 44 | 78 | 73 | 85 | 104 | 81 | 80 | 106 | 94 | |
| 106 | 104 | 132 | 147 | 185 | 160 | 137 | 195 | 180 | |
| 222 | 203 | 250 | 302 | 310 | 258 | 250 | 404 | 408 | |
| 592 | 538 | 569 | 648 | 653 | 598 | 650 | 873 | 943 | |
| 22 | 23 | 22 | 19 | 19 | 19 | 23 | 21 | 20 | |
| 576 | 387 | 596 | 579 | 587 | 541 | 578 | 649 | 709 | |
| 178 | 133 | 144 | 137 | 171 | 158 | 157 | 183 | 160 | |
| 677 | 589 | 597 | 624 | 588 | 613 | 612 | 811 | 822 | |
| 139 | 101 | 147 | 129 | 122 | 122 | 154 | 198 | 232 | |
| 254 | 332 | 325 | 345 | 360 | 382 | 434 | 576 | 656 | |
| 417 | 441 | 547 | 570 | 655 | 658 | 628 | 803 | 716 | |
| 33 | 30 | 38 | 42 | 42 | 42 | 39 | 65 | 46 | |
| 44 | 63 | 75 | 60 | 50 | 35 | 58 | 76 | 70 | |
| 190 | 176 | 191 | 211 | 221 | 225 | 166 | 217 | 264 | |
| 19 | 17 | 18 | 18 | 17 | 21 | 38 | 14 | 15 | |
| 427 | 372 | 388 | 395 | 352 | 311 | 287 | 362 | 409 | |
| 152 | 135 | 157 | 185 | 173 | 215 | 230 | 216 | 306 | |
| 901 | 662 | 671 | 696 | 577 | 611 | 601 | 875 | 918 | |
| 661 | 551 | 593 | 735 | 679 | 647 | 707 | 884 | 991 | |
| 11 | 15 | 22 | 17 | 15 | 20 | 21 | 30 | 24 | |
| 630 | 578 | 669 | 721 | 828 | 760 | 724 | 1,004 | 1,020 | |
| 214 | 250 | 324 | 322 | 318 | 265 | 333 | 342 | 342 | |
| 102 | 99 | 138 | 129 | 127 | 102 | 126 | 157 | 204 | |
| 749 | 620 | 673 | 723 | 791 | 781 | 722 | 994 | 1,101 | |
| 32 | 27 | 28 | 25 | 19 | 16 | 23 | 29 | 40 | |
| 337 | 363 | 448 | 426 | 444 | 481 | 527 | 622 | 656 | |
| 22 | 26 | 35 | 38 | 34 | 32 | 29 | 52 | 45 | |
| 495 | 417 | 460 | 563 | 557 | 604 | 596 | 753 | 810 | |
| 1,501 | 1,389 | 1,538 | 1,669 | 1,653 | 1,557 | 1,694 | 2,212 | 2,391 | |
| 63 | 61 | 60 | 80 | 79 | 67 | 82 | 95 | 91 | |
| 12 | 16 | 16 | 11 | 15 | 14 | 11 | 14 | 10 | |
| 490 | 339 | 374 | 455 | 455 | 425 | 436 | 531 | 606 | |
| 231 | 211 | 239 | 216 | 266 | 275 | 241 | 322 | 346 | |
| 105 | 162 | 135 | 116 | 160 | 166 | 198 | 226 | ||
| 93 | 103 | 80 | 108 | 112 | 97 | 92 | 114 | 114 | |
| 236 | 166 | 243 | 256 | 202 | 204 | 226 | 334 | 348 | |
| 16 | 24 | 17 | 17 | 19 | 22 | 25 | 25 | 16 |
See also
- Crime in the United States
- Firearm death rates in the United States by state
- Gun violence in the United States by state
- List of countries by intentional homicide rate
- List of cities by murder rate
- List of federal subjects of Russia by murder rate
- List of Brazilian states by murder rate
- List of Mexican states by homicides
- Homicide in world cities
References
- 1 2 3 4 Homicide Mortality by State. National Center for Health Statistics. Centers for Disease Control and Prevention.
- 1 2 3 New Hampshire. National Center for Health Statistics. Centers for Disease Control and Prevention.
- 1 2 3 Vermont. National Center for Health Statistics. Centers for Disease Control and Prevention.
- 1 2 3 Wyoming. National Center for Health Statistics. Centers for Disease Control and Prevention.
- 1 2 3 Washington, D.C.. National Center for Health Statistics. Centers for Disease Control and Prevention.
- 1 2 3 District Crime Data at a Glance. Metropolitan Police Department of the District of Columbia.
- ↑ "Statistical Abstract of the United States". U.S. Census Bureau. Government Printing Office. p. 187. Retrieved 10 September 2017.
- ↑ Cohen, Thomas H.; Reaves, Bryan A. (1 February 2006). "Felony Defendants in Large Urban Counties, 2002". Bureau of Justice Statistics. U.S. Department of Justice. Retrieved 10 September 2017.
- ↑ Bosman, Julie (27 May 2015). "Nebraska Bans Death Penalty, Defying a Veto". The New York Times.
- ↑ "State by State".
- ↑ "Death Sentences and Executions 2013" (PDF). Amnesty International. 2014. Retrieved 10 September 2017.
- ↑ "Executions by year since 1976". Death Penalty Information Center. June 4, 2015. Retrieved July 3, 2015.
- ↑ "2019".
- ↑ "The Death Penalty in 2019: Year End Report".
- 1 2 "18 U.S. Code § 1841 – Protection of unborn children". Legal Information Institute. Cornell Law School. Retrieved 10 September 2017.