.png.webp)
This is a list of U.S. states with firearm death rates per 100,000 population.
National statistics
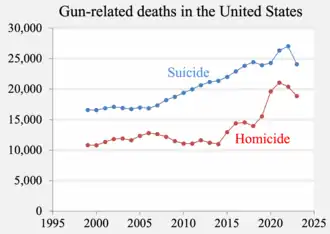
An estimated 20,966 firearm homicides and 26,320 firearm suicides occurred in the United States during 2021.[3] In 2020, over 45,000 people in the United States (13.6 per 100,000 people) died by firearms. More than half of these people died by suicide. According to the FBI's 2020 Uniform Crime Report, the total number of murders increased by nearly one-third from 2019 to 2020. In both years, three-quarters of these murders were committed with firearms; that percentage slightly increased from 2019 (74%) to 2020 (77%).[4]
In 2017 and 2018, of all trauma-based deaths in the United States (including car crashes), firearm deaths caused the greatest loss of "years of potential life," a unit of measurement that considers each person's age at death.[5]
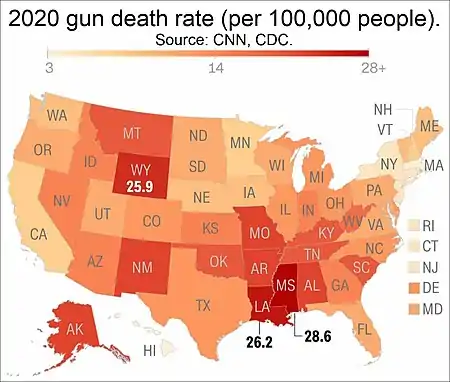
2020 firearm death rates by state. Map
Includes suicides. State abbreviations on the map are explained in the table in the next section.
2019 firearm death rates and counts by state. Table and map
Includes suicides and non-homicides, too.

* below indicates "Crime in STATE" links.
| State | Abbreviation | Rate per 100,000 people | Gun Deaths | Murders | |
|---|---|---|---|---|---|
| AK | 24.4 | 179 | 69 | ||
| MS | 24.2 | 710 | 194 | ||
| NM | 22.3 | 471 | 198 | ||
| WY | 22.3 | 133 | 13 | ||
| AL | 22.2 | 1076 | 358 | ||
| LA | 22.1 | 1013 | 544 | ||
| MO | 20.6 | 1252 | 568 | ||
| SC | 19.9 | 1012 | 464 | ||
| AR | 19.3 | 580 | 568 | ||
| MT | 19 | 209 | 27 | ||
| OK | 18.6 | 737 | 266 | ||
| TN | 18.4 | 1270 | 498 | ||
| WV | 16.6 | 300 | 78 | ||
| GA | 15.8 | 1695 | 654 | ||
| NV | 15.3 | 490 | 143 | ||
| AZ | 15.1 | 1136 | 365 | ||
| KY | 14.9 | 682 | 221 | ||
| CO | 14.2 | 846 | 218 | ||
| ID | 14.2 | 255 | 35 | ||
| IN | 14.1 | 958 | 377 | ||
| KS | 13.7 | 403 | 105 | ||
| OH | 13.3 | 1578 | 538 | ||
| NC | 13.1 | 1397 | 632 | ||
| SD | 13.1 | 113 | 17 | ||
| UT | 12.8 | 394 | 72 | ||
| FL | 12.7 | 2872 | 1122 | ||
| TX | 12.7 | 3683 | 1409 | ||
| MD | 12.6 | 757 | 542 | ||
| OR | 12.6 | 566 | 116 | ||
| ND | 12.4 | 93 | 24 | ||
| MI | 12.1 | 1220 | 556 | ||
| PA | 11.7 | 1541 | 669 | ||
| VA | 11.7 | 1025 | 426 | ||
| ME | 11.5 | 163 | 20 | ||
| IL | 10.8 | 1367 | 832 | ||
| NH | 10.7 | 156 | 33 | ||
| WA | 10.7 | 842 | 198 | ||
| NE | 10.4 | 205 | 45 | ||
| WI | 10 | 604 | 175 | ||
| DE | 9.9 | 93 | 48 | ||
| VT | 9.3 | 67 | 11 | ||
| IA | 9.1 | 294 | 60 | ||
| MN | 8.1 | 465 | 117 | ||
| CA | 7.2 | 2945 | 1690 | ||
| CT | 5.3 | 190 | 104 | ||
| RI | 4.6 | 48 | 25 | ||
| HI | 4.4 | 62 | 48 | ||
| NJ | 4.1 | 368 | 262 | ||
| NY | 3.9 | 804 | 558 | ||
| MA | 3.4 | 247 | 152 |
Murders
This is a list of the U.S. states and the District of Columbia. The population data is the official data from the U.S. Census Bureau.[7] The murder rates and gun murder rates were calculated based on the FBI reports.[8] The official population of each state for 2010 and gun ownership rates were added for context.[9]
The gun murders in 2010 from FBI Uniform Crime Reporting (UCR) program was 8,775.[10] The total number of murders from all weapons was 12,996.[10] These figures includes murders and willful manslaughters, but excludes "deaths caused by negligence, suicide, or accident" and justifiable homicides.[11] The U.S. reports a 70% conviction rate for murder prosecutions.[12]
| State | Population (total inhabitants) (2010) | Population density (inhabitants per square mile) (2010) | Murders
(total deaths) (2010) |
Gun
murders (total deaths)(2010) |
Estimated Gun
ownership (%)(2013) |
Murders
(rate per 100,000 inhabitants)(2010) |
Gun
murders (rate per 100,000 inhabitants) (2010) |
|---|---|---|---|---|---|---|---|
| Alabama | 4,779,736 | 94.65 | 199 | 135 | 48.9% | 4.2 | 2.8 |
| Alaska | 710,231 | 1.264 | 31 | 19 | 61.7% | 4.4 | 2.7 |
| Arizona | 6,392,017 | 57.05 | 326 | 232 | 32.3% | 4.5 | 3.6 |
| Arkansas | 2,915,918 | 56.43 | 130 | 93 | 57.9% | 4.5 | 3.2 |
| California | 37,253,956 | 244.2 | 1,811 | 1,257 | 20.1% | 4.9 | 3.4 |
| Colorado | 5,029,196 | 49.33 | 117 | 65 | 34.3% | 2.3 | 1.3 |
| Connecticut | 3,574,097 | 741.4 | 131 | 97 | 16.6% | 3.7 | 2.7 |
| Delaware | 897,934 | 470.7 | 48 | 38 | 5.2% | 5.3 | 4.2 |
| District of Columbia | 601,723 | 10298 | 131 | 99 | 25.9% | 21.8 | 16.5 |
| Florida | 19,687,653 | 360.2 | 987 | 669 | 32.5% | 5.0 | 3.4 |
| Georgia | 9,920,000 | 165 | 527 | 376 | 31.6% | 5.3 | 3.8 |
| Hawaii | 1,360,301 | 216.8 | 24 | 7 | 45.1% | 1.8 | 0.5 |
| Idaho | 1,567,582 | 19.5 | 21 | 12 | 56.9% | 1.3 | 0.8 |
| Illinois | 12,830,632 | 231.9 | 706 | 364 | 26.2% | 5.5 | 2.8 |
| Indiana | 6,483,802 | 182.5 | 198 | 142 | 33.8% | 3.1 | 2.2 |
| Iowa | 3,046,355 | 54.81 | 38 | 21 | 33.8% | 1.2 | 0.7 |
| Kansas | 2,853,118 | 35.09 | 100 | 63 | 32.2% | 3.5 | 2.2 |
| Kentucky | 4,339,367 | 110.0 | 180 | 116 | 42.4% | 4.5 | 2.7 |
| Louisiana | 4,533,372 | 105.0 | 437 | 351 | 44.5% | 9.6 | 7.7 |
| Maine | 1,328,361 | 43.04 | 24 | 11 | 22.6% | 1.8 | 0.8 |
| Maryland | 5,773,552 | 606.2 | 424 | 293 | 20.7% | 7.3 | 5.1 |
| Massachusetts | 6,547,629 | 852.1 | 209 | 118 | 22.6% | 3.2 | 1.8 |
| Michigan | 9,883,640 | 174.8 | 558 | 413 | 28.8% | 5.6 | 4.2 |
| Minnesota | 5,303,925 | 67.14 | 91 | 53 | 36.7% | 1.7 | 1.0 |
| Mississippi | 2,967,297 | 63.50 | 165 | 120 | 42.8% | 5.6 | 4.0 |
| Missouri | 5,988,927 | 87.26 | 419 | 321 | 27.1% | 7.0 | 5.4 |
| Montana | 989,415 | 6.858 | 21 | 12 | 52.3% | 2.1 | 1.2 |
| Nebraska | 1,826,341 | 23.97 | 51 | 32 | 19.8% | 2.8 | 1.8 |
| Nevada | 2,700,551 | 24.80 | 158 | 84 | 37.5% | 5.9 | 3.1 |
| New Hampshire | 1,316,470 | 147.0 | 13 | 5 | 14.4% | 1.0 | 0.4 |
| New Jersey | 8,791,894 | 1189 | 363 | 246 | 11.3% | 4.1 | 2.8 |
| New Mexico | 2,059,179 | 17.16 | 118 | 67 | 49.9% | 5.7 | 3.3 |
| New York | 19,378,102 | 415.3 | 860 | 517 | 10.3% | 4.4 | 2.7 |
| North Carolina | 9,535,483 | 200.6 | 445 | 286 | 28.7% | 4.7 | 3.0 |
| North Dakota | 672,591 | 9.916 | 9 | 4 | 47.9% | 1.3 | 0.6 |
| Ohio | 11,536,504 | 282.5 | 460 | 310 | 19.6% | 4.0 | 2.7 |
| Oklahoma | 3,751,351 | 55.22 | 188 | 111 | 31.2% | 5.0 | 3.0 |
| Oregon | 3,831,074 | 40.33 | 78 | 36 | 26.6% | 2.0 | 0.9 |
| Pennsylvania | 12,702,379 | 285.3 | 646 | 457 | 27.1% | 5.1 | 3.6 |
| Rhode Island | 1,052,567 | 1006 | 29 | 16 | 5.8% | 2.8 | 1.5 |
| South Carolina | 4,625,364 | 157.1 | 280 | 207 | 44.4% | 6.1 | 4.5 |
| South Dakota | 814,180 | 10.86 | 14 | 8 | 35.0% | 1.7 | 1.0 |
| Tennessee | 6,346,105 | 156.6 | 356 | 219 | 39.4% | 5.6 | 3.5 |
| Texas | 25,145,561 | 98.07 | 1,246 | 805 | 35.7% | 5.0 | 3.2 |
| Utah | 2,763,885 | 34.30 | 52 | 22 | 31.9% | 1.9 | 0.8 |
| Vermont | 625,741 | 67.73 | 7 | 2 | 28.8% | 1.1 | 0.3 |
| Virginia | 8,001,024 | 207.3 | 369 | 250 | 29.3% | 4.6 | 3.1 |
| Washington | 6,724,540 | 102.6 | 151 | 93 | 27.7% | 2.2 | 1.4 |
| West Virginia | 1,852,994 | 77.06 | 55 | 27 | 54.2% | 3.0 | 1.5 |
| Wisconsin | 5,686,986 | 105.2 | 151 | 97 | 34.7% | 2.7 | 1.7 |
| Wyoming | 563,626 | 5.851 | 8 | 5 | 53.8% | 1.4 | 0.9 |
See also
- Right to keep and bear arms in the United States
- Gun politics in the United States
- Index of gun politics articles
- Gun laws in the United States by state
- Gun violence in the United States by state
- Suicide in the United States
- List of cities by murder rate
- Percent of households with guns by country
- Number of guns per capita by country
- List of countries by firearm-related death rate
- List of countries by intentional death rate - homicide plus suicide.
- List of countries by intentional homicide rate
- List of countries by suicide rate
- List of U.S. states by homicide rate
- List of U.S. states by incarceration rate
- United States cities by crime rate (60,000-100,000)
- United States cities by crime rate (100,000–250,000)
- List of United States cities by crime rate (100 largest)
References
- ↑ ● Data through 2016: "Guns / Firearm-related deaths". NSC.org copy of U.S. Government (CDC) data. Centers for Disease Control and Prevention. December 2017. Archived from the original on August 29, 2018. Retrieved August 29, 2018. (archive of actual data).
● 2017 data: Howard, Jacqueline (December 13, 2018). "Gun deaths in US reach highest level in nearly 40 years, CDC data reveal". CNN. Archived from the original on December 13, 2018. (2017 CDC data)
● 2018 data: "New CDC Data Show 39,740 People Died by Gun Violence in 2018". efsgv.org. January 31, 2020. Archived from the original on February 16, 2020. (2018 CDC data)
● 2019-2023 data: "Past Summary Ledgers". Gun Violence Archive. January 2024. Archived from the original on 5 January 2024. - ↑
● Murder Victims by Weapon, 2012–2016, Federal Bureau of Investigation Uniform Crime Reporting Program. Archived from the original on January 18, 2020. (used only for 2012 and 2013 data)
● Murder Victims by Weapon, 2014–2018, Federal Bureau of Investigation Uniform Crime Reporting Program. Archived from the original on January 18, 2020.
● Murder Victims by Weapon, 2015–2019, Federal Bureau of Investigation Uniform Crime Reporting Program. Archived from the original on November 22, 2020. - ↑ Notes from the Field: Increases in Firearm Homicide and Suicide Rates — United States, 2020–2021. Centers for Disease Control and Prevention. Morbidity and Mortality Weekly Report (MMWR).
- 1 2 States with weaker gun laws have higher rates of firearm related homicides and suicides, study finds. By Emma Tucker and Priya Krishnakumar, CNN, Jan 20, 2022.
- ↑ Ahmed, Tasnim; Elamroussi, Aya (23 February 2022). "Guns overtake car crashes as leading cause of US trauma-related deaths, study says". CNN. Retrieved 2022-02-23.
- 1 2 Stats of the States - Firearm Mortality. National Center for Health Statistics. Part of the Centers for Disease Control and Prevention (CDC). The map legend can be clicked at the source to highlight the rate ranges on the map. Any state can be clicked for detailed demographic statistics.
- ↑ "U.S. Census 2010 Interactive Map".
- ↑ "Murder by State, Types of Weapons, 2010".
- ↑ Kalesan, Bindu; Villarreal, Marcos D.; Keyes, Katherine M.; Galea, Sandro (2015-06-09). "Gun ownership and social gun culture". Injury Prevention. 22: injuryprev–2015–041586. doi:10.1136/injuryprev-2015-041586. ISSN 1353-8047. PMC 4809774. PMID 26124073.
- 1 2 "Table 20". FBI.
- ↑ "Murder". FBI.
- ↑ "Bureau of Justice Statistics (BJS) - FAQ Detail". www.bjs.gov.