The following list of countries by carbon intensity of GDP sorts countries by their emission intensity. Carbon intensity or emission intensity of GDP is a measure that evaluates the amount of carbon dioxide (CO2) emissions produced per unit of GDP. It provides an indication of how efficiently an economy uses carbon-based resources to generate economic output. A lower carbon intensity indicates that less CO2 is emitted to produce a given level of economic output, indicating a more carbon-efficient economy.
List
Countries
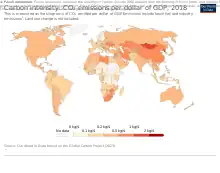
Countries by carbon intensity of GDP. Carbon intensity is measured by CO2 emission in kilograms per International dollar (US dollar adjusted for purchasing power parity) of economic output.[1] Data are for the year 2018.
| Country | CO₂ kg/$ | |
|---|---|---|
| 1 | 1.18 | |
| 2 | 1.16 | |
| 3 | 1.09 | |
| 4 | 0.72 | |
| 5 | 0.65 | |
| 6 | 0.57 | |
| 7 | 0.54 | |
| 8 | 0.54 | |
| 9 | 0.53 | |
| 10 | 0.53 | |
| 11 | 0.52 | |
| 12 | 0.52 | |
| 13 | 0.52 | |
| 14 | 0.51 | |
| 15 | 0.50 | |
| 16 | 0.47 | |
| 17 | 0.44 | |
| 18 | 0.44 | |
| 19 | 0.44 | |
| 20 | 0.42 | |
| 21 | 0.42 | |
| 22 | 0.42 | |
| 23 | 0.41 | |
| 24 | 0.38 | |
| 25 | 0.37 | |
| 26 | 0.37 | |
| 27 | 0.35 | |
| 28 | 0.35 | |
| 29 | 0.35 | |
| 30 | 0.35 | |
| 31 | 0.35 | |
| 32 | 0.34 | |
| 33 | 0.34 | |
| 34 | 0.33 | |
| 35 | 0.33 | |
| 36 | 0.33 | |
| 37 | 0.32 | |
| 38 | 0.31 | |
| 39 | 0.30 | |
| 40 | 0.29 | |
| 41 | 0.29 | |
| 42 | 0.29 | |
| 43 | 0.29 | |
| 44 | 0.29 | |
| 45 | 0.28 | |
| 46 | 0.28 | |
| 47 | 0.27 | |
| 48 | 0.27 | |
| 49 | 0.27 | |
| 50 | 0.27 | |
| 51 | 0.26 | |
| 52 | 0.26 | |
| 53 | 0.26 | |
| 54 | 0.26 | |
| 55 | 0.25 | |
| 56 | 0.25 | |
| 57 | 0.25 | |
| 58 | 0.24 | |
| 59 | 0.24 | |
| 60 | 0.24 | |
| 61 | 0.24 | |
| 62 | 0.24 | |
| 63 | 0.24 | |
| 64 | 0.24 | |
| 65 | 0.24 | |
| 66 | 0.24 | |
| 67 | 0.24 | |
| 68 | 0.23 | |
| 69 | 0.23 | |
| 70 | 0.23 | |
| 71 | 0.22 | |
| 72 | 0.22 | |
| 73 | 0.22 | |
| 74 | 0.22 | |
| 75 | 0.22 | |
| 76 | 0.22 | |
| 77 | 0.22 | |
| 78 | 0.22 | |
| 79 | 0.21 | |
| 80 | 0.21 | |
| 81 | 0.21 | |
| 82 | 0.21 | |
| 83 | 0.21 | |
| 84 | 0.21 | |
| 85 | 0.21 | |
| 86 | 0.20 | |
| 87 | 0.20 | |
| 88 | 0.20 | |
| 89 | 0.20 | |
| 90 | 0.20 | |
| 91 | 0.19 | |
| 92 | 0.19 | |
| 93 | 0.19 | |
| 94 | 0.19 | |
| 95 | 0.19 | |
| 96 | 0.18 | |
| 97 | 0.18 | |
| 98 | 0.18 | |
| 99 | 0.18 | |
| 100 | 0.18 | |
| 101 | 0.17 | |
| 102 | 0.17 | |
| 103 | 0.17 | |
| 104 | 0.17 | |
| 105 | 0.17 | |
| 106 | 0.17 | |
| 107 | 0.17 | |
| 108 | 0.17 | |
| 109 | 0.16 | |
| 110 | 0.16 | |
| 111 | 0.16 | |
| 112 | 0.16 | |
| 113 | 0.16 | |
| 114 | 0.16 | |
| 115 | 0.16 | |
| 116 | 0.15 | |
| 117 | 0.15 | |
| 118 | 0.15 | |
| 119 | 0.15 | |
| 120 | 0.15 | |
| 121 | 0.15 | |
| 122 | 0.14 | |
| 123 | 0.14 | |
| 124 | 0.13 | |
| 125 | 0.13 | |
| 126 | 0.13 | |
| 127 | 0.13 | |
| 128 | 0.13 | |
| 129 | 0.13 | |
| 130 | 0.13 | |
| 131 | 0.12 | |
| 132 | 0.12 | |
| 133 | 0.12 | |
| 134 | 0.12 | |
| 135 | 0.12 | |
| 136 | 0.12 | |
| 137 | 0.12 | |
| 138 | 0.11 | |
| 139 | 0.11 | |
| 140 | 0.11 | |
| 141 | 0.11 | |
| 142 | 0.11 | |
| 143 | 0.10 | |
| 144 | 0.10 | |
| 145 | 0.10 | |
| 146 | 0.10 | |
| 147 | 0.10 | |
| 148 | 0.10 | |
| 149 | 0.10 | |
| 150 | 0.10 | |
| 151 | 0.09 | |
| 152 | 0.09 | |
| 153 | 0.09 | |
| 154 | 0.08 | |
| 155 | 0.08 | |
| 156 | 0.07 | |
| 157 | 0.07 | |
| 158 | 0.07 | |
| 159 | 0.07 | |
| 160 | 0.06 | |
| 161 | 0.06 | |
| 162 | 0.06 | |
| 163 | 0.03 |
World regions
| Region | CO₂ kg/$ |
|---|---|
| Asia | 0.38 |
| Oceania | 0.33 |
| World | 0.32 |
| North America | 0.29 |
| Europe | 0.23 |
| Africa | 0.23 |
| South America | 0.18 |
Income groups
| Income group | CO₂ kg/$ |
|---|---|
| Upper-middle-income countries | 0.44 |
| Lower-middle-income countries | 0.26 |
| High income countries | 0.25 |
| Low-income countries | 0.21 |
Historical development
Development of CO2 emission in kilograms per International dollar of economic output in major countries over time.[1]
| Country | 1820 | 1850 | 1900 | 1950 | 1970 | 1980 | 1990 | 2000 | 2010 | 2018 | 1950–2018 (change) |
|---|---|---|---|---|---|---|---|---|---|---|---|
| 0.10 | 0.22 | 0.30 | 0.29 | 0.33 | 0.27 | 0.24 | 0.22 | −1% | |||
| 0.42 | 0.56 | 0.61 | 0.66 | 0.60 | 0.51 | 0.41 | 0.34 | −40% | |||
| 0.03 | 0.06 | 0.10 | 0.13 | 0.13 | 0.13 | 0.12 | +376% | ||||
| 0.71 | 1.24 | 1.01 | 0.77 | 0.59 | 0.44 | 0.37 | 0.28 | 0.22 | −78% | ||
| 0.12 | 0.16 | 0.21 | 0.18 | 0.18 | 0.20 | 0.16 | 0.16 | −2% | |||
| 0.81 | 0.95 | 0.82 | 0.70 | 0.55 | 0.50 | 0.40 | 0.35 | −63% | |||
| 0.18 | 0.71 | 0.79 | 0.73 | 0.61 | 0.67 | 0.57 | +216% | ||||
| 0.05 | 0.21 | 0.69 | 0.58 | 0.49 | 0.39 | 0.24 | 0.20 | 0.16 | 0.12 | −78% | |
| 0.09 | 0.20 | 1.26 | 1.21 | 0.76 | 0.62 | 0.52 | 0.33 | 0.25 | 0.19 | −84% | |
| 0.04 | 0.17 | 0.24 | 0.29 | 0.33 | 0.35 | 0.32 | 0.29 | +71% | |||
| 0.02 | 0.09 | 0.16 | 0.22 | 0.20 | 0.24 | 0.22 | 0.20 | +111% | |||
| 0.13 | 0.16 | 0.36 | 0.33 | 0.30 | 0.25 | 0.21 | 0.17 | +7% | |||
| 0.21 | 0.40 | 0.48 | 0.38 | 0.31 | 0.30 | 0.27 | 0.23 | −41% | |||
| 0.04 | 0.31 | 0.31 | 0.39 | 0.38 | 0.32 | 0.28 | 0.24 | −22% | |||
| 0.54 | 0.53 | 0.57 | 0.53 | 0.39 | 0.28 | 0.25 | 0.19 | −63% | |||
| 0.06 | 0.22 | 0.44 | 0.23 | 0.29 | 0.14 | 0.10 | +68% | ||||
| 0.13 | 0.21 | 0.20 | 0.23 | 0.23 | 0.19 | 0.17 | +28% | ||||
| 0.10 | 0.23 | 0.19 | 0.18 | 0.22 | 0.15 | 0.16 | +55% | ||||
| 1.16 | 1.32 | 1.42 | 1.21 | 0.65 | 0.42 | 0.32 | −72% | ||||
| 1.20 | 1.25 | 1.38 | 0.96 | 0.52 | 0.47 | −65% | |||||
| 0.37 | 0.61 | 0.80 | 0.91 | 0.61 | 0.45 | 0.37 | −0% | ||||
| 1.11 | 1.02 | 1.11 | 1.33 | 1.11 | 0.80 | 0.65 | −42% | ||||
| 0.10 | 0.56 | 0.58 | 0.42 | 0.41 | 0.38 | 0.34 | +226% | ||||
| 0.23 | 0.34 | 0.36 | 0.41 | 0.31 | 0.28 | 0.19 | 0.18 | −47% | |||
| 0.54 | 0.38 | 0.57 | 0.36 | 0.24 | 0.18 | 0.13 | 0.09 | −76% | |||
| 0.26 | 0.19 | 0.27 | 0.23 | 0.19 | 0.14 | 0.10 | 0.07 | −63% | |||
| 0.61 | 1.04 | 1.34 | 0.90 | 0.68 | 0.50 | 0.40 | 0.30 | 0.23 | 0.15 | −83% | |
| 0.03 | 0.23 | 1.08 | 1.10 | 0.88 | 0.71 | 0.55 | 0.46 | 0.37 | 0.30 | −73% | |
| 0.06 | 0.56 | 0.26 | 0.19 | 0.24 | 0.34 | 0.41 | +645% |
References
- 1 2 "Carbon emission intensity of economies". Our World in Data. Retrieved 2023-06-21.