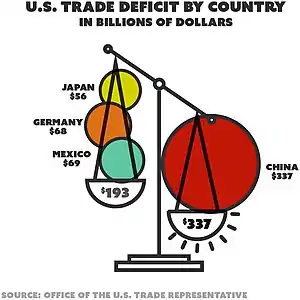
This is a list of countries by current account balance (CAB). Note: the concept of a "current account balance" refers to a "trade balance" between the reference country and its trading partners. CAB records the value of exports and imports of both goods and services and international transfers of capital.
CIA World Factbook data
Top 20 economies with the largest surplus
This is a list of the 20 countries and territories with the largest surplus in current account balance (CAB), based on data from 2019 est. as listed in the CIA World Factbook.[1]
| Economy | CAB (million US$) |
Year |
|---|---|---|
| 317,301 | 2021 EST. | |
| 313,754 | 2021 EST. | |
| 157,743 | 2021 EST. | |
| 90,207 | 2019 EST. | |
| 79,937 | 2019 EST. | |
| 65,311 | 2019 EST. | |
| 65,173 | 2019 EST. | |
| 63,109 | 2019 EST. | |
| 59,971 | 2019 EST. | |
| 59,517 | 2019 EST. | |
| 37,033 | 2019 EST. | |
| 30,935 | 2019 EST. | |
| 29,603 | 2019 EST. | |
| | 26,470 | 2017 EST. |
| 22,469 | 2019 EST. | |
| 22,339 | 2019 EST. | |
| 20,642 | 2020 EST. | |
| 16,750 | 2017 EST. | |
| 16,656 | 2019 EST. | |
| 15,230 | 2017 EST. | |
Top 20 countries with the largest deficit
By CAB

This is a list of the 20 countries and territories with the largest deficit in current account balance (CAB), based on data from 2019 est. as listed in the CIA World Factbook.[1]
| Country | CAB (million US$) |
Year |
|---|---|---|
| -480,225 | 2019 EST. | |
| | -121,921 | 2019 EST. |
| -57,594 | 2019 EST. | |
| -50,927 | 2019 EST. | |
| -44,954 | 2019 EST. | |
| -35,425 | 2019 EST. | |
| -30,359 | 2019 EST. | |
| -29,748 | 2019 EST. | |
| -22,100 | 2017 EST. | |
| -18,102 | 2019 EST. | |
| -13,748 | 2019 EST. | |
| -12,370 | 2017 EST. | |
| -11,389 | 2019 EST. | |
| -10,933 | 2019 EST. | |
| -10,760 | 2017 EST. | |
| -10,626 | 2019 EST. | |
| -8,915 | 2019 EST. | |
| -7,206 | 2019 EST. | |
| -7,143 | 2019 EST. | |
| -6,962 | 2019 EST. |
By GDP
This is a list of the 20 countries and territories with the largest deficit in gross domestic product (GDP), based on data from 2017 est. as listed in the CIA World Factbook.[2]
| Country | Deficit (as % of GDP) | Year |
|---|---|---|
| -75.7 | 2017 EST. | |
| -64.1 | 2017 EST. | |
| -46.1 | 2017 EST. | |
| -25.1 | 2017 EST. | |
| -17.3 | 2017 EST. | |
| -15.1 | 2017 EST. | |
| -13.8 | 2017 EST. | |
| -12.6 | 2017 EST. | |
| -10.8 | 2017 EST. | |
| -10.6 | 2017 EST. | |
| -10.1 | 2017 EST. | |
| -10.1 | 2017 EST. | |
| -10 | 2017 EST. | |
| -9.8 | 2017 EST. | |
| -9.6 | 2017 EST. | |
| -9.6 | 2017 EST. | |
| -9.2 | 2017 EST. | |
| -9 | 2017 EST. | |
| -8.9 | 2017 EST. | |
| -8.7 | 2017 EST. |
Eurostat data
This table shows the account balance of both the Euro Area and the European Union as a whole, according to data from Eurostat (in EUR).[3]
| Country | CAB (million Euros) |
Year |
|---|---|---|
| 386,567 | 2017 | |
| 201,910 | 2017 |
See also
References
- 1 2 "The World Factbook — Central Intelligence Agency". www.cia.gov.
- ↑ "Budget surplus (+) or deficit (-) - The World Factbook". www.cia.gov. Retrieved 2021-11-29.
- ↑ "Eurostat - Tables, Graphs and Maps Interface (TGM) table". ec.europa.eu.