Tianzhu County
天柱县 | |
|---|---|
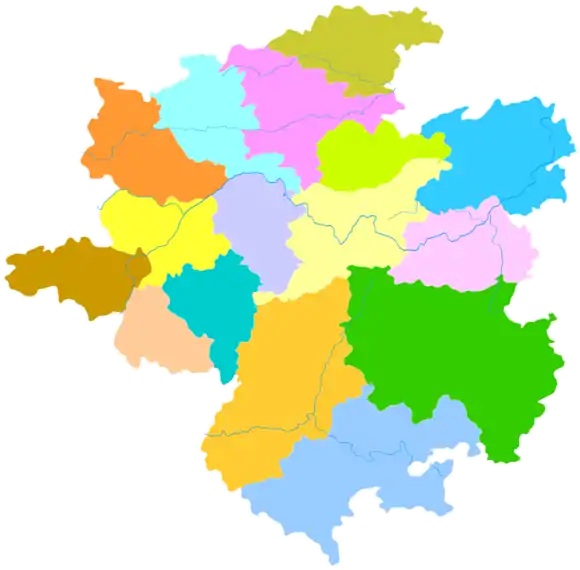 Tianzhu is the easternmost division in this map of Qiandongnan | |
.png.webp) Qiandongnan in Guizhou | |
| Coordinates (Tianzhu County government): 26°54′35″N 109°12′28″E / 26.9097°N 109.2078°E | |
| Country | People's Republic of China |
| Province | Guizhou |
| Autonomous prefecture | Qiandongnan |
| Area | |
| • Total | 2,201 km2 (850 sq mi) |
| Population (2010) | |
| • Total | 263,841 |
| • Density | 120/km2 (310/sq mi) |
| Time zone | UTC+8 (China Standard) |
Tianzhu County (simplified Chinese: 天柱县; traditional Chinese: 天柱縣; pinyin: Tiānzhù Xiàn) is a county in eastern Guizhou province, China, bordering Hunan province to the north, east, and southeast. It is under the administration of the Qiandongnan Miao and Dong Autonomous Prefecture.
Climate
| Climate data for Tianzhu (1991–2020 normals, extremes 1981–2010) | |||||||||||||
|---|---|---|---|---|---|---|---|---|---|---|---|---|---|
| Month | Jan | Feb | Mar | Apr | May | Jun | Jul | Aug | Sep | Oct | Nov | Dec | Year |
| Record high °C (°F) | 26.0 (78.8) |
31.5 (88.7) |
35.4 (95.7) |
35.1 (95.2) |
35.2 (95.4) |
35.7 (96.3) |
38.1 (100.6) |
37.8 (100.0) |
36.9 (98.4) |
34.9 (94.8) |
30.7 (87.3) |
25.2 (77.4) |
38.1 (100.6) |
| Mean daily maximum °C (°F) | 8.6 (47.5) |
11.5 (52.7) |
15.9 (60.6) |
22.3 (72.1) |
26.2 (79.2) |
28.9 (84.0) |
31.6 (88.9) |
31.5 (88.7) |
28.0 (82.4) |
22.2 (72.0) |
17.2 (63.0) |
11.4 (52.5) |
21.3 (70.3) |
| Daily mean °C (°F) | 5.1 (41.2) |
7.5 (45.5) |
11.4 (52.5) |
17.1 (62.8) |
21.2 (70.2) |
24.4 (75.9) |
26.6 (79.9) |
25.9 (78.6) |
22.4 (72.3) |
17.3 (63.1) |
12.3 (54.1) |
7.1 (44.8) |
16.5 (61.7) |
| Mean daily minimum °C (°F) | 2.8 (37.0) |
4.8 (40.6) |
8.4 (47.1) |
13.5 (56.3) |
17.6 (63.7) |
21.3 (70.3) |
22.9 (73.2) |
22.2 (72.0) |
18.8 (65.8) |
14.2 (57.6) |
9.1 (48.4) |
4.3 (39.7) |
13.3 (56.0) |
| Record low °C (°F) | −8.2 (17.2) |
−5.3 (22.5) |
−2.3 (27.9) |
3.1 (37.6) |
6.7 (44.1) |
12.6 (54.7) |
15.4 (59.7) |
16.0 (60.8) |
10.7 (51.3) |
2.8 (37.0) |
−1.3 (29.7) |
−5.3 (22.5) |
−8.2 (17.2) |
| Average precipitation mm (inches) | 54.8 (2.16) |
55.5 (2.19) |
94.4 (3.72) |
129.6 (5.10) |
197.2 (7.76) |
236.0 (9.29) |
173.3 (6.82) |
133.8 (5.27) |
96.1 (3.78) |
86.6 (3.41) |
61.9 (2.44) |
44.7 (1.76) |
1,363.9 (53.7) |
| Average precipitation days (≥ 0.1 mm) | 15.8 | 14.9 | 18.4 | 17.7 | 17.5 | 16.9 | 12.8 | 12.3 | 10.6 | 13.4 | 11.8 | 11.6 | 173.7 |
| Average snowy days | 3.8 | 2.0 | 0.4 | 0 | 0 | 0 | 0 | 0 | 0 | 0 | 0 | 1.3 | 7.5 |
| Average relative humidity (%) | 83 | 81 | 82 | 81 | 81 | 83 | 80 | 81 | 81 | 82 | 82 | 80 | 81 |
| Mean monthly sunshine hours | 36.8 | 45.9 | 59.5 | 89.3 | 105.1 | 96.7 | 168.5 | 172.2 | 127.2 | 91.9 | 84.2 | 65.3 | 1,142.6 |
| Percent possible sunshine | 11 | 14 | 16 | 23 | 25 | 23 | 40 | 43 | 35 | 26 | 26 | 20 | 25 |
| Source: China Meteorological Administration[1][2] | |||||||||||||
References
- ↑ 中国气象数据网 – WeatherBk Data (in Simplified Chinese). China Meteorological Administration. Retrieved 28 April 2023.
- ↑ 中国气象数据网 (in Simplified Chinese). China Meteorological Administration. Retrieved 28 April 2023.
This article is issued from Wikipedia. The text is licensed under Creative Commons - Attribution - Sharealike. Additional terms may apply for the media files.