| ||||||||||||||||||||||||||||||||||||||||||||||||||||||||
32 seats in the Legislative Assembly 17 seats in the Senate | ||||||||||||||||||||||||||||||||||||||||||||||||||||||||
This lists parties that won seats. See the complete results below.
| ||||||||||||||||||||||||||||||||||||||||||||||||||||||||
 |
|---|
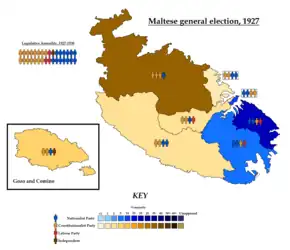
General elections were held in Malta between 7 and 9 August 1927.[1] Although the Nationalist Party received the most votes, the Constitutional Party emerged as the largest party, winning 15 of the 32 seats in the Legislative Assembly. The Nationalist Party remained the largest party in the Senate with four of the seven elected seats.[2]
Electoral system
The elections were held using the single transferable vote system, whilst suffrage was limited to men meeting certain property qualifications.[3]
Results
Legislative Assembly
| Party | Votes | % | Seats | +/– | |
|---|---|---|---|---|---|
| Nationalist Party | 14,321 | 41.58 | 13 | –2 | |
| Constitutional Party | 14,290 | 41.49 | 15 | +5 | |
| Labour Party | 5,011 | 14.55 | 3 | –4 | |
| Independents | 822 | 2.39 | 1 | +1 | |
| Total | 34,444 | 100.00 | 32 | 0 | |
| Valid votes | 34,444 | 99.20 | |||
| Invalid/blank votes | 277 | 0.80 | |||
| Total votes | 34,721 | 100.00 | |||
| Registered voters/turnout | 44,089 | 78.75 | |||
| Source: Nohlen & Stöver | |||||
Senate
| Party | First count | Second count | Seats | +/– | |||
|---|---|---|---|---|---|---|---|
| Votes | % | Votes | % | ||||
| Nationalist Party | 2,410 | 58.07 | 2,230 | 60.17 | 4 | 0 | |
| Constitutional Party | 1,654 | 39.86 | 1,476 | 39.83 | 3 | +1 | |
| Labour Party | 86 | 2.07 | 0 | –1 | |||
| Appointed members | 10 | 0 | |||||
| Total | 4,150 | 100.00 | 3,706 | 100.00 | 17 | 0 | |
| Source: Schiavone | |||||||
References
- ↑ Dieter Nohlen & Philip Stöver (2010) Elections in Europe: A data handbook, p1302 ISBN 978-3-8329-5609-7
- ↑ Michael J Schiavone (1987) L-Elezzjonijiet F'Malta 1849–1981, Pubblikazzjoni Bugelli, p190
- ↑ Nohlen & Stöver, p1298
This article is issued from Wikipedia. The text is licensed under Creative Commons - Attribution - Sharealike. Additional terms may apply for the media files.

