| |||||||||||||||||||||||||||||||||||||||||||||||||||||||||||||
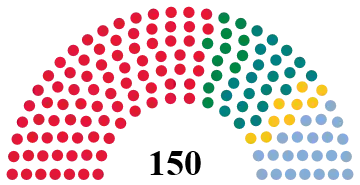
All 150 seats in the Norwegian Parliament 76 seats were needed for a majority | |||||||||||||||||||||||||||||||||||||||||||||||||||||||||||||
|---|---|---|---|---|---|---|---|---|---|---|---|---|---|---|---|---|---|---|---|---|---|---|---|---|---|---|---|---|---|---|---|---|---|---|---|---|---|---|---|---|---|---|---|---|---|---|---|---|---|---|---|---|---|---|---|---|---|---|---|---|---|
| |||||||||||||||||||||||||||||||||||||||||||||||||||||||||||||
 Results by county | |||||||||||||||||||||||||||||||||||||||||||||||||||||||||||||
| |||||||||||||||||||||||||||||||||||||||||||||||||||||||||||||
Parliamentary elections were held in Norway on 10 October 1949.[1] The result was a victory for the Labour Party, which won 85 of the 150 seats in the Storting.
Endorsements
| Newspaper | Party endorsed | |
|---|---|---|
| Minerva | Conservative Party[2] | |
Results
 | |||||
|---|---|---|---|---|---|
| Party | Votes | % | Seats | +/– | |
| Labour Party | 803,471 | 45.69 | 85 | +9 | |
| Conservative Party | 279,790 | 15.91 | 21 | –2 | |
| Liberal Party | 218,866 | 12.45 | 20 | +1 | |
| Christian Democratic Party | 147,068 | 8.36 | 9 | +1 | |
| Communist Party | 102,722 | 5.84 | 0 | –11 | |
| Farmers' Party | 85,418 | 4.86 | 6 | +2 | |
| Farmers–Conservatives–Liberals[lower-alpha 1] | 45,311 | 2.58 | 4 | – | |
| Farmers–Conservatives[lower-alpha 2] | 35,860 | 2.04 | 3 | – | |
| Farmers–Liberals[lower-alpha 3] | 22,408 | 1.27 | 2 | – | |
| Society Party | 13,088 | 0.74 | 0 | New | |
| Christians–Liberals[lower-alpha 4] | 4,334 | 0.25 | 0 | – | |
| Wild votes | 30 | 0.00 | – | – | |
| Total | 1,758,366 | 100.00 | 150 | 0 | |
| Valid votes | 1,758,366 | 99.29 | |||
| Invalid/blank votes | 12,531 | 0.71 | |||
| Total votes | 1,770,897 | 100.00 | |||
| Registered voters/turnout | 2,159,065 | 82.02 | |||
| Source: Nohlen & Stöver | |||||
Seat distribution
| Constituency | Total seats |
Seats won | ||||
|---|---|---|---|---|---|---|
| Ap | H | V | B | KrF | ||
| Akershus | 7 | 4 | 2 | 1 | ||
| Aust-Agder | 4 | 3 | 1 | |||
| Bergen | 5 | 3 | 1 | 1 | ||
| Buskerud | 5 | 3 | 1 | 1 | ||
| Finnmark | 3 | 3 | ||||
| Hedmark | 7 | 5 | 1 | 1 | ||
| Hordaland | 8 | 3 | 1 | 2 | 2 | |
| Market towns of Akershus and Østfold |
4 | 3 | 1 | |||
| Market towns of Buskerud | 3 | 2 | 1 | |||
| Market towns of Hedmark and Oppland |
3 | 2 | 1 | |||
| Market towns of Møre og Romsdal | 3 | 2 | 1 | |||
| Market towns of Nordland, Troms and Finnmark |
4 | 2 | 1 | 1 | ||
| Market towns of Sør-Trøndelag and Nord-Trøndelag |
5 | 3 | 2 | |||
| Market towns of Telemark and Aust-Agder |
5 | 3 | 1 | 1 | ||
| Market towns of Vest-Agder and Rogaland |
7 | 4 | 1 | 2 | ||
| Market towns of Vestfold | 4 | 2 | 2 | |||
| Møre og Romsdal | 7 | 2 | 2 | 3 | ||
| Nord-Trøndelag | 5 | 3 | 1 | 1 | ||
| Nordland | 8 | 5 | 1 | 1 | 1 | |
| Oppland | 6 | 4 | 2 | |||
| Oslo | 7 | 4 | 3 | |||
| Østfold | 6 | 3 | 2 | 1 | ||
| Rogaland | 5 | 2 | 1 | 1 | 1 | |
| Sogn og Fjordane | 5 | 2 | 2 | 1 | ||
| Sør-Trøndelag | 6 | 3 | 1 | 1 | 1 | |
| Telemark | 5 | 3 | 1 | 1 | ||
| Troms | 5 | 4 | 1 | |||
| Vest-Agder | 4 | 1 | 2 | 1 | ||
| Vestfold | 4 | 2 | 1 | 1 | ||
| Total | 150 | 85 | 23 | 21 | 12 | 9 |
| Source: Norges Offisielle Statistikk | ||||||
Notes
- ↑ The joint list of the Farmers' Party, Conservative Party and Liberal Party won four seats, two taken by the Conservative Party and two by the Farmers' Party.[3]
- ↑ The joint list of the Farmers' Party and Conservative Party won three seats, all taken by the Farmers' Party.[3]
- ↑ The joint list of the Farmers' Party and Liberal Party won two seats, with both parties taking one each.[3]
- ↑ The joint list of the Liberal Party and Christian Democratic Party won no seats.[3]
References
This article is issued from Wikipedia. The text is licensed under Creative Commons - Attribution - Sharealike. Additional terms may apply for the media files.


.jpg.webp)
