| |||||||||||||||||
| |||||||||||||||||
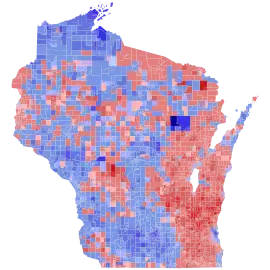
  Doyle: 30–40% 40–50% 50–60% 60–70% 70–80% 80–90% >90% Green: 40–50% 50–60% 60–70% 70–80% 80–90% >90% Tie: 40–50% 50% No data | |||||||||||||||||
| |||||||||||||||||
| Elections in Wisconsin |
|---|
 |
The 2006 Wisconsin gubernatorial election was held on November 7, 2006. Incumbent Democratic Governor Jim Doyle ran for re-election to a second term in office. Doyle was unopposed in the Democratic primary, and he faced U.S. Representative Mark Green, who was unopposed in the Republican primary, in the general election. The campaign between Doyle and Green was competitive and hotly contested, but Doyle, whose approval ratings hovered around 50%, had the upper hand.[1] In the end, Doyle defeated Green by a fairly comfortable margin, improving on his 2002 victory in the process.
This was the only Wisconsin gubernatorial election won by a Democrat with an outright majority of the vote between 1982 and 2022, and remains the largest winning margin garnered by a Democrat since 1982. As of 2023, this is the last gubernatorial election in which the Democratic candidate carried the counties of Burnett, Washburn, Sawyer, Iron, Price, Lincoln, Oneida, Forest, Marathon, Wood, Clark, Chippewa, Rusk, Barron, Dunn, Polk, St. Croix, Pierce, Pepin, Buffalo, Jackson, Monroe, Adams, Lafayette, Outagamie, and Winnebago. This election was the first time since 1974 that an incumbent Democratic Governor was re-elected or won re-election.
Democratic primary
Candidates
- Jim Doyle, incumbent Governor of Wisconsin
Results
| Party | Candidate | Votes | % | |
|---|---|---|---|---|
| Democratic | Jim Doyle (incumbent) | 318,523 | 100.00% | |
| Total votes | 318,523 | 100.00% | ||
Republican primary
Candidates
Withdrew
- Scott Walker, Milwaukee County Executive and former State Representative[3]
Results
| Party | Candidate | Votes | % | |
|---|---|---|---|---|
| Republican | Mark Green | 233,216 | 100.00% | |
| Total votes | 233,216 | 100.00% | ||
Green Party primary
Candidates
- Nelson Eisman
Results
| Party | Candidate | Votes | % | |
|---|---|---|---|---|
| Green | Nelson Eisman | 1,707 | 100.00% | |
| Total votes | 1,707 | 100.00% | ||
General election
Predictions
| Source | Ranking | As of |
|---|---|---|
| The Cook Political Report[4] | Tossup | November 6, 2006 |
| Sabato's Crystal Ball[5] | Lean D | November 6, 2006 |
| Rothenberg Political Report[6] | Tossup | November 2, 2006 |
| Real Clear Politics[7] | Lean D | November 6, 2006 |
Polling
| Source | Date | Jim Doyle (D) |
Mark Green (R) |
|---|---|---|---|
| WISC-TV | November 2, 2006 | 50% | 44% |
| Strategic Vision | October 31, 2006 | 47% | 45% |
| Zogby/WSJ | October 31, 2006 | 46.7% | 47.2% |
| Badger Poll Archived November 26, 2007, at the Wayback Machine | October 30, 2006 | 50% | 36% |
| Rasmussen | October 29, 2006 | 48% | 44% |
| Wisconsin Public Radio | October 18, 2006 | 51% | 38% |
| Strategic Vision | October 11, 2006 | 46% | 43% |
| Rasmussen | September 25, 2006 | 47% | 44% |
| Strategic Vision | September 20, 2006 | 46% | 42% |
| Zogby/WSJ | September 11, 2006 | 49.4% | 45.7% |
| Zogby/WSJ | August 28, 2006 | 49.7% | 43.1% |
| Rasmussen | August 20, 2006 | 49% | 41% |
| Strategic Vision | August 18, 2006 | 45% | 44% |
| Research 2000 | August 17, 2006 | 48% | 38% |
| Zogby/WSJ | July 24, 2006 | 49.2% | 44.7% |
| Rasmussen | July 20, 2006 | 47% | 41% |
| Strategic Vision | July 20, 2006 | 43% | 42% |
| University of Wisconsin Archived July 15, 2006, at the Wayback Machine | July 2, 2006 | 49% | 36% |
| WPRI | June 23, 2006 | 49% | 37% |
| Zogby/WSJ | June 21, 2006 | 46.9% | 45.1% |
| Strategic Vision | June 8, 2006 | 45% | 46% |
| Strategic Vision | May 3, 2006 | 45% | 43% |
| Rasmussen | April 28, 2006 | 47% | 43% |
| Strategic Vision | April 13, 2006 | 43% | 43% |
| WPR/St. Norbert College Survey | March 29 – April 7, 2006 | 43% | 35% |
| Rasmussen Archived June 14, 2006, at the Wayback Machine | March 29, 2006 | 45% | 40% |
| Strategic Vision | March 8, 2006 | 44% | 44% |
| Rasmussen | February 7, 2006 | 48% | 41% |
| Strategic Vision | February 1, 2006 | 44% | 43% |
| Strategic Vision | December 22, 2005 | 45% | 43% |
| Rasmussen Archived December 16, 2005, at the Wayback Machine | December 12, 2005 | 45% | 39% |
| Strategic Vision | November 16, 2005 | 47% | 44% |
| Strategic Vision | October 21, 2005 | 47% | 43% |
Results
| Party | Candidate | Votes | % | ±% | |
|---|---|---|---|---|---|
| Democratic | Jim Doyle (incumbent) | 1,139,115 | 52.76% | +7.60% | |
| Republican | Mark Green | 979,427 | 45.36% | +3.92% | |
| Green | Nelson Eisman | 40,709 | 1.89% | -0.60% | |
| Total votes | 2,159,251 | 100.00% | N/A | ||
| Democratic hold | |||||
Counties that flipped Republican to Democratic
- Burnett (largest village: Grantsburg)
- Clark (largest city: Neillsville)
- Outagamie (largest city: Appleton)
- Door (largest city: Sturgeon Bay)
- Sawyer (largest city: Hayward)
- Winnebago (largest city: Oshkosh)
- St. Croix (Largest city: Hudson)
- Chippewa (largest city: Chippewa Falls)
Counties that flipped from Libertarian to Democratic
Counties that flipped from Libertarian to Republican
Counties that flipped from Democratic to Republican
See also
References
- ↑ "SurveyUSA | America's Neighborhood Pollster".
- 1 2 3 4 "Archived copy" (PDF). Archived from the original (PDF) on May 30, 2010. Retrieved January 3, 2013.
{{cite web}}: CS1 maint: archived copy as title (link) - ↑ Schultze, Steve (April 20, 2009). "Walker gov announcement expected April 28". Milwaukee, Wisconsin Journal Sentinel. Retrieved April 27, 2015.
- ↑ "2006 Governor Race Ratings for November 6, 2006" (PDF). The Cook Political Report. Archived from the original (PDF) on June 5, 2008. Retrieved October 1, 2006.
- ↑ "Election Eve 2006: THE FINAL PREDICTIONS". Sabato's Crystal Ball. Retrieved June 25, 2021.
- ↑ "2006 Gubernatorial Ratings". Senate Ratings. The Rothenberg Political Report. Retrieved June 25, 2021.
- ↑ "Election 2006". Real Clear Politics. Retrieved June 25, 2021.
_a.jpg.webp)
_a.jpg.webp)