.svg.png.webp) | ||||||||||||||||||||||||||||||||||||||||||||||||||||||||||||||||||||||||||||||||||||||||||||||||||||||||||||||||
| ||||||||||||||||||||||||||||||||||||||||||||||||||||||||||||||||||||||||||||||||||||||||||||||||||||||||||||||||
All 200 seats in the National Council (101 seats needed for a majority) All 46 seats in the Council of States (24 seats needed for a majority) | ||||||||||||||||||||||||||||||||||||||||||||||||||||||||||||||||||||||||||||||||||||||||||||||||||||||||||||||||
| Turnout | 48.5% | |||||||||||||||||||||||||||||||||||||||||||||||||||||||||||||||||||||||||||||||||||||||||||||||||||||||||||||||
|---|---|---|---|---|---|---|---|---|---|---|---|---|---|---|---|---|---|---|---|---|---|---|---|---|---|---|---|---|---|---|---|---|---|---|---|---|---|---|---|---|---|---|---|---|---|---|---|---|---|---|---|---|---|---|---|---|---|---|---|---|---|---|---|---|---|---|---|---|---|---|---|---|---|---|---|---|---|---|---|---|---|---|---|---|---|---|---|---|---|---|---|---|---|---|---|---|---|---|---|---|---|---|---|---|---|---|---|---|---|---|---|---|
This lists parties that won seats. See the complete results below.
| ||||||||||||||||||||||||||||||||||||||||||||||||||||||||||||||||||||||||||||||||||||||||||||||||||||||||||||||||
| This article is part of a series on the |
.svg.png.webp) |
|---|
|
|
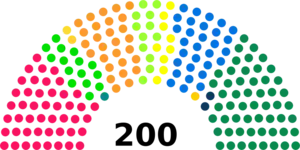
Federal elections were held in Switzerland on 23 October 2011. All of the Federal Assembly were to be elected: all 200 seats in the National Council and all 46 seats in the Council of States.
Voter turnout was 49.1%, compared to 48.9% in 2007.[1]
National Council
At the last election, in 2007, the Swiss People's Party (SVP) won the highest share of the vote ever recorded for a single party in Switzerland, with 29% of the vote. Soon after, a moderate faction split from the SVP, forming the Conservative Democratic Party (BDP).
In the 2011 election, the two neophyte parties BDP and Green Liberal Party (GLP) were successful, each receiving 5.4% of the popular vote. Both the GLP and the BDP have gained the required five seats to form their own parliamentary groups, suggesting a split of the centrist CVP/EVP/glp group.
All other major parties lost votes, the Swiss People's Party (SVP) for the first time since the 1987 elections. With 26.6% of the popular vote, the SVP is still the strongest party by a comfortable margin, but the 2011 elections marked the end of its rapid growth during the period of 1995–2007.
Of the small parties (below 5 seats), the Evangelical People's Party received 2.0% of the vote (+0.4%), retaining its two seats. The Ticino League received 0.8% of the vote (+0.2%) and gains one seat, now holding two.
The Christian Social Party lost one seat, but gained another to remain in the National Council, while the Federal Democratic Union of Switzerland and Swiss Party of Labour lost their single seats. Other minor groups which gathered more than 0.1% of the popular vote are: the Swiss Pirate Party (0.48%), the Swiss Democrats (0.20%), parteifrei.ch (0.19%) and Tierpartei Schweiz (0.15%).
 | |||||
|---|---|---|---|---|---|
| Party | Votes | % | Seats | +/– | |
| Swiss People's Party | 648,675 | 26.61 | 54 | −8 | |
| Social Democratic Party | 457,317 | 18.76 | 46 | +3 | |
| FDP.The Liberals | 368,951 | 15.13 | 30 | −1 | |
| Christian Democratic People's Party | 300,544 | 12.33 | 28 | −3 | |
| Green Party | 205,984 | 8.45 | 15 | −5 | |
| Green Liberal Party | 131,436 | 5.39 | 12 | +9 | |
| Conservative Democratic Party | 132,279 | 5.43 | 9 | +9 | |
| Evangelical People's Party | 48,789 | 2.00 | 2 | 0 | |
| Ticino League | 19,657 | 0.81 | 2 | +1 | |
| Geneva Citizens' Movement | 10,714 | 0.44 | 1 | +1 | |
| Federal Democratic Union | 31,056 | 1.27 | 0 | −1 | |
| Swiss Party of Labour | 21,482 | 0.88 | 0 | −1 | |
| Christian Social Party | 6,248 | 0.26 | 0 | –1 | |
| Others | 54,622 | 2.24 | 1 | – | |
| Total | 2,437,754 | 100.00 | 200 | 0 | |
| Valid votes | 2,437,754 | 98.08 | |||
| Invalid/blank votes | 47,649 | 1.92 | |||
| Total votes | 2,485,403 | 100.00 | |||
| Registered voters/turnout | 5,124,034 | 48.50 | |||
| Source: Swiss Federal Statistical Office (in French) Statistics Switzerland (in German) Turnout | |||||
By constituency
Council of States
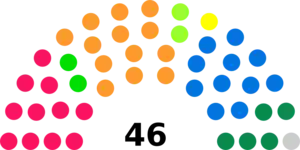
The elections of the Council of States are done by a plurality voting system. 27 out of 46 seats were determined on the first ballot on 23 October; the remaining 19 seats were decided in a second ballot held in November.
 | |||
|---|---|---|---|
| Party | Seats | +/– | |
| Christian Democratic People's Party | 13 | –2 | |
| FDP.The Liberals | 11 | -1 | |
| Social Democratic Party | 11 | +2 | |
| Swiss People's Party | 5 | –2 | |
| Green Party | 2 | 0 | |
| Green Liberal Party | 2 | +1 | |
| Conservative Democratic Party | 1 | +1 | |
| Independents | 1 | +1 | |
| Total | 46 | 0 | |
| Source: Politik-Stat | |||
By canton
Pre-election polls
| Pollster | Date | SVP | SPS | FDP | CVP | GPS | GLP | BDP | EVP | EDU | PdA | LdT | CSP | oth. |
|---|---|---|---|---|---|---|---|---|---|---|---|---|---|---|
| gfs.bern[2] | 1–8 October 2011 | 29.3 | 19.9 | 15.2 | 14.2 | 9.3 | 4.9 | 3.6 | 1.5 | 1.0 | n.c. | n.c. | n.c. | 1.1 |
| Isopublic[3] | 1–23 September 2011 | 28.2 | 20.3 | 15.7 | 14.2 | 9.8 | 5.2 | 3.2 | n.c. | n.c. | n.c. | n.c. | n.c. | 3.4 |
| gfs.bern[4] | 23 August – 3 September 2011 | 28.0 | 20.5 | 15.6 | 14.5 | 9.5 | 4.5 | 3.1 | 1.6 | 1.0 | n.c. | n.c. | n.c. | 1.7 |
| demoscope.ch[5] | 25 July – 6 August 2011 | 24.8 | 19.5 | 17.8 | 12.4 | 9.9 | 7.2 | 3.0 | n.c. | n.c. | n.c. | n.c. | n.c. | 5.4 |
| gfs.bern[4] | 25 July – 6 August 2011 | 27.4 | 18.5 | 16.1 | 15.0 | 10.1 | 4.6 | 2.9 | 1.7 | 1.7 | n.c. | n.c. | n.c. | 2.0 |
| gfs.bern[6] | 13–26 June 2011 | 27.5 | 18.9 | 15.0 | 13.4 | 10.0 | 5.2 | 3.0 | 2.4 | 1.3 | n.c. | n.c. | n.c. | 3.3 |
| Isopublic[7] | 8–18 June 2011 | 28.7 | 18.6 | 13.9 | 13.2 | 9.9 | 8.0 | 3.7 | 1.0 | 0.1 | n.c. | n.c. | 0.2 | 1.8 |
| gfs.bern[6] | 4–16 April 2011 | 29.9 | 17.7 | 15.2 | 12.7 | 10.9 | 5.7 | 3.5 | 1.5 | 1.1 | n.c | n.c | n.c | 1.8 |
| Isopublic[8] | 17–26 March 2011 | 25.4 | 18.2 | 15.4 | 14.3 | 10.5 | 6.1 | 2.8 | n.c | n.c | n.c | n.c | n.c | 7.3 |
| gfs.bern[6] | 10–22 January 2011 | 29.8 | 18.0 | 17.7 | 12.9 | 8.8 | 5.2 | 2.6 | 2.2 | 1.5 | n.c | n.c | n.c | 1.4 |
| Isopublic[9] | 10–21 December 2010 | 26.0 | 19.1 | 17.1 | 13.8 | 9.1 | 3.2 | 4.5 | 1.4 | 1.2 | 0.5 | n.c | n.c | 4.1 |
| gfs.bern[6] | 28 Sept. – 11 Oct. 2010 | 26.1 | 20.1 | 17.2 | 14.1 | 8.5 | 3.8 | 3.6 | 2.4 | 0.6 | 0.7 | 0.2 | 0.7 | 2.0 |
| 2007 federal election[10] | 21 October 2007 | 28.9 | 19.5 | 17.7 | 14.5 | 9.6 | 1.4 | — | 2.4 | 1.3 | 0.7 | 0.6 | 0.4 | 2.9 |
Notes and references
- ↑ "Wahlbeteiligung 2011". Politik-stat.ch. Retrieved 17 January 2015.
- ↑ "gfs.bern AG - öffentliche Meinung; Umfragen; Issue-Analysen; Politik, Kommunikation, Gesellschaft, Trends". Gfsbern.ch. Retrieved 17 January 2015.
- ↑ "Detail - SonntagsZeitung". Sonntagszeitung.ch. Retrieved 17 January 2015.
- 1 2 "Archived copy". www.gfsbern.ch. Archived from the original on 29 March 2012. Retrieved 15 January 2022.
{{cite web}}: CS1 maint: archived copy as title (link) - ↑ "demoscope.ch" (PDF). Archived from the original (PDF) on 31 March 2012. Retrieved 3 September 2011.
- 1 2 3 4 "Barometer of voting". Kunden.gfsbern.ch. Archived from the original (JPG) on 21 March 2012. Retrieved 17 January 2015.
- ↑ "Auswertung ISOPUBLIC POLITBAROMETER im Auftrag der SonntagsZeitung & Le Matin Dimanche" (PDF). Archived from the original (PDF) on 15 August 2011. Retrieved 28 June 2011.
- ↑ "Einen Moment bitte, die Ausgabe wird geladen" (PDF). Archived from the original (PDF) on 1 October 2011. Retrieved 2 June 2011.
- ↑ "ISOPUBLIC POLITBAROMETER im Auftrag der SonntagsZeitung & Le Matin Dimanche" (PDF). Isopublic.ch. Archived from the original (PDF) on 7 December 2012. Retrieved 17 January 2015.
- ↑ "politiquesuisse.5gigs.net". Archived from the original on 23 July 2011. Retrieved 13 February 2011.
