Bulgarians are the main ethnic group in Bulgaria, according to the census of the population in 2011 they are 6,000,000 people, or 86% of the country's population.[1]
Number and share
Censuses

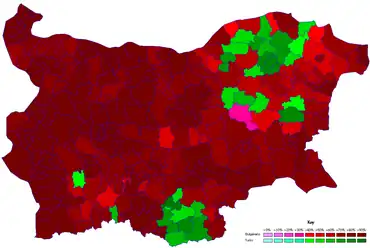
Municipalities where Bulgarians represent a majority of the population, according to the census of the population in 2011 (red color).

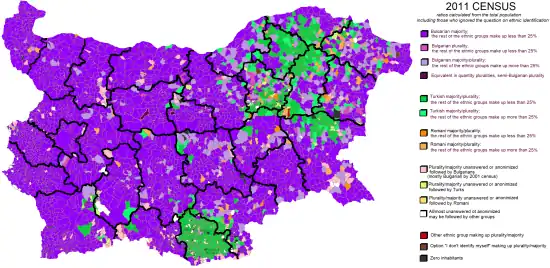
Places where Bulgarians represent a majority of the population, according to the census of the population in 2011 (purple color).
Number and share of Bulgarians according to the census over the years:[2]
| Year | Share (in %) | Number |
| 1900 | 77.1 | 2 888 219 |
| 1905 | 79.4 | 3 203 810 |
| 1910 | 81.1 | 3 518 756 |
| 1920 | 83.3 | 4 036 056 |
| 1926 | 83.2 | 4 557 706 |
| 1934 | 85.6 | 5 204 217 |
| 1946 | 84.0 | 5 903 580 |
| 1956 | 85.5 | 6 506 541 |
| 1965 | 87.9 | 7 231 243 |
| 1975 | 90.9 | 7 930 024 |
| 1992 | 85.7 | 7 271 185 |
| 2001 | 83.9 | 6 655 210 |
| 2011 | 76.9 | 5 664 624 |
Number and share of Bulgarians according to the census over the years by provinces:[3][4]
| Province | Number | Share (in %) | ||
|---|---|---|---|---|
| 2001 | 2011 | 2001 | 2011 | |
| Total | 6,655,210 | 5,664,624 | 83.9 | 76.9 |
| Blagoevgrad | 286,491 | 251,097 | 83.97 | 77.60 |
| Burgas | 338,625 | 298,128 | 79.94 | 71.69 |
| Dobrich | 164,204 | 131,114 | 76.29 | 69.12 |
| Gabrovo | 131,494 | 106,406 | 91.23 | 86.71 |
| Haskovo | 224,757 | 180,541 | 80.99 | 73.31 |
| Kardzhali | 55,939 | 39,519 | 34.10 | 25.86 |
| Kyustendil | 152,644 | 121,351 | 93.91 | 88.78 |
| Lovech | 152,194 | 118,346 | 89.55 | 83.68 |
| Montana | 157,507 | 123,820 | 86.41 | 83.60 |
| Pazardzhik | 261,260 | 206,110 | 84.08 | 74.80 |
| Pernik | 145,642 | 120,929 | 97.20 | 90.55 |
| Pleven | 280,475 | 219,612 | 89.90 | 81.41 |
| Plovdiv | 621,338 | 540,303 | 86.80 | 79.10 |
| Razgrad | 67,069 | 49,229 | 44.00 | 39.32 |
| Ruse | 213,408 | 176,413 | 80.18 | 74.98 |
| Shumen | 123,084 | 99,446 | 60.22 | 55.08 |
| Silistra | 84,178 | 64,050 | 59.28 | 53.60 |
| Sliven | 163,188 | 132,697 | 74.69 | 67.19 |
| Smolyan | 122,806 | 86,847 | 87.67 | 71.33 |
| Sofia | 253,536 | 210,974 | 92.78 | 85.24 |
| Sofia City | 1,124,240 | 1,136,433 | 96.01 | 87.98 |
| Stara Zagora | 319,379 | 265,618 | 86.17 | 79.70 |
| Targovishte | 76,294 | 58,371 | 55.41 | 48.31 |
| Varna | 393,884 | 371,048 | 85.25 | 78.10 |
| Veliko Tarnovo | 259,099 | 211,353 | 88.37 | 81.76 |
| Vidin | 118,543 | 86,802 | 91.13 | 85.92 |
| Vratsa | 223,692 | 151,183 | 92.04 | 80.91 |
| Yambol | 140,240 | 106,884 | 89.85 | 81.31 |
See also
References
- ↑ Преброяване 2011. НСИ, стр. 4.
- ↑ "Население по местоживеене, пол и етническа група". nsi.bg. Archived from the original on 30 May 2017. Retrieved 2 June 2017.
- ↑ "Етнически състав на населението в България". miris.eurac.edu. Archived from the original on 15 July 2018. Retrieved 2 June 2017.
- ↑ "Ethnic composition: 2011 census". pop-stat.mashke.org. Retrieved 2 June 2017.
This article is issued from Wikipedia. The text is licensed under Creative Commons - Attribution - Sharealike. Additional terms may apply for the media files.