Gmina Połaniec
Połaniec Commune | |
|---|---|
 Flag  Coat of arms | |
 | |
| Coordinates (Połaniec): 50°25′48.95″N 21°17′05.69″E / 50.4302639°N 21.2849139°E | |
| Country | |
| Voivodeship | Świętokrzyskie |
| County | Staszów |
| Seat | Połaniec |
| Area (through the years 2006–2010)[1] | |
| • Total | 75.01 km2 (28.96 sq mi) |
| Population (31 December 2010 at Census)[1] | |
| • Total | 11,848 |
| • Density | 160/km2 (410/sq mi) |
| • Urban | 8,227 |
| • Rural | 3,621 |
| Time zone | UTC+1 (CET) |
| • Summer (DST) | UTC+2 (CEST) |
| Postal code | 28–230 |
| Area code | +48 15 |
| Car plates | TSZ |
| Website | http://www.polaniec.pl/ |
Gmina Połaniec[2][3] is an urban-rural gmina (administrative district) in Staszów County, Świętokrzyskie Voivodeship, in south-central Poland. Its seat is the town of Połaniec, which lies approximately 17 kilometres (11 mi) south-east of Staszów and 69 km (43 mi) south-east of the regional capital Kielce.
The gmina covers an area of 75.01 square kilometres (29.0 sq mi), and as of 2010 its total population is ![]() 11,848 (out of which the population of Połaniec amounts to
11,848 (out of which the population of Połaniec amounts to ![]() 8,227, and the population of the rural part of the gmina is
8,227, and the population of the rural part of the gmina is ![]() 3,621).
3,621).
Demography
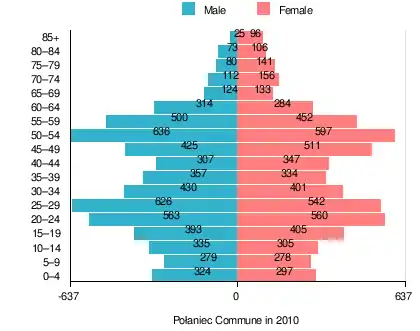
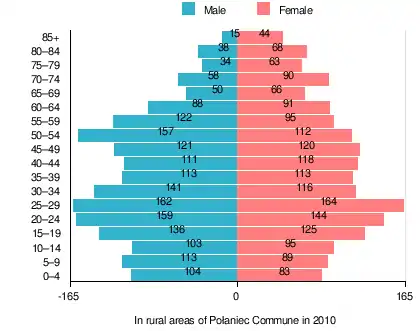
According to the 2011 Poland census, there were 11,848 people residing in Połaniec Commune, of whom 49.8% were male and 50.2% were female (out of which the population in rural areas amounts to 3,621, of whom 50.4% were male and 49.6% were female). In the commune, the population was spread out, with 19.1% under the age of 18, 40.6% from 18 to 44, 29% from 45 to 64, and 11.2% who were 65 years of age or older (out of which the population in rural areas amounts to 20.4% under the age of 18, 40.1% from 18 to 44, 22.5% from 45 to 64, and 17.0% who were 65 years of age or older).[1]
Table 1. Population level of commune in 2010 – by age group[1] SPECIFICATION Measure
unitPOPULATION
(by age group in 2010)TOTAL 0–4 5–9 10–14 15–19 20–24 25–29 30–34 35–39 40–44 45–49 50–54 55–59 60–64 65–69 70–74 75–79 80–84 85 + I. TOTAL person 11,848 621 557 640 798 1,123 1,168 831 691 654 936 1,233 952 598 257 268 221 179 121 — of which in % 100 5.2 4.7 5.4 6.7 9.5 9.9 7 5.8 5.5 7.9 10.4 8 5 2.2 2.3 1.9 1.5 1 1. BY SEX A. Males person 5,903 324 279 335 393 563 626 430 357 307 425 636 500 314 124 112 80 73 25 — of which in % 49.8 2.7 2.4 2.8 3.3 4.8 5.3 3.6 3 2.6 3.6 5.4 4.2 2.7 1 0.9 0.7 0.6 0.2 B. Females person 5,945 297 278 305 405 560 542 401 334 347 511 597 452 284 133 156 141 106 96 — of which in % 50.2 2.5 2.3 2.6 3.4 4.7 4.6 3.4 2.8 2.9 4.3 5 3.8 2.4 1.1 1.3 1.2 0.9 0.8
Table 2. Population level in rural areas in 2010 – by age group[1] SPECIFICATION Measure
unitPOPULATION
(by age group in 2010)TOTAL 0–4 5–9 10–14 15–19 20–24 25–29 30–34 35–39 40–44 45–49 50–54 55–59 60–64 65–69 70–74 75–79 80–84 85 + I. TOTAL person 3,621 187 202 198 261 303 326 257 226 229 241 269 217 179 116 148 97 106 59 — of which in % 100 5.2 5.6 5.5 7.2 8.4 9 7.1 6.2 6.3 6.7 7.4 6 4.9 3.2 4.1 2.7 2.9 1.6 1. BY SEX A. Males person 1,825 104 113 103 136 159 162 141 113 111 121 157 122 88 50 58 34 38 15 — of which in % 50.4 2.9 3.1 2.8 3.8 4.4 4.5 3.9 3.1 3.1 3.3 4.3 3.4 2.4 1.4 1.6 0.9 1 0.4 B. Females person 1,796 83 89 95 125 144 164 116 113 118 120 112 95 91 66 90 63 68 44 — of which in % 49.6 2.3 2.5 2.6 3.5 4 4.5 3.2 3.1 3.3 3.3 3.1 2.6 2.5 1.8 2.5 1.7 1.9 1.2
Table 3. Population level of commune in 2010 – by sex[1] SPECIFICATION Measure
unitPOPULATION
(by sex in 2010)TOTAL Males Females I. TOTAL person 11,848 5,903 5,945 — of which in % 100 49.8 50.2 1. BY AGE GROUP A. At pre-working age person 2,268 1,155 1,113 — of which in % 19.1 9.7 9.4 B. At working age. grand total person 8,250 4,334 3,916 — of which in % 69.6 36.6 33 a. at mobile working age person 4,815 2,459 2,356 — of which in | % 40.6 20.8 19.8 b. at non-mobile working age person 3,435 1,875 1,560 — of which in | % 29 15.8 13.2 C. At post-working age person 1,330 414 916 — of which in % 11.2 3.5 7.7
Table 4. Population level in rural areas in 2010 – by sex[1] SPECIFICATION Measure
unitPOPULATION
(by sex in 2010)TOTAL Males Females I. TOTAL person 3,621 1,825 1,796 — of which in % 100 50.4 49.6 1. BY AGE GROUP A. At pre-working age person 738 396 342 — of which in % 20.4 10.9 9.4 B. At working age. grand total person 2,266 1,234 1,032 — of which in % 62.6 34.1 28.5 a. at mobile working age person 1,451 746 705 — of which in | % 40.1 20.6 19.5 b. at non-mobile working age person 815 488 327 — of which in | % 22.5 13.5 9 C. At post-working age person 617 195 422 — of which in % 17 5.4 11.7
Villages
Apart from the town of Połaniec, Gmina Połaniec contains the villages and settlements of Brzozowa, Kamieniec, Kraśnik, Łęg, Luszyca, Maśnik, Okrągła, Rudniki, Ruszcza, Ruszcza-Kępa, Rybitwy, Tursko Małe, Tursko Małe-Kolonia, Winnica, Wymysłów, Zawada, Zdzieci Nowe, Zdzieci Stare and Zrębin.
Neighbouring gminas
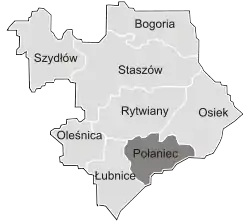
Gmina Połaniec is bordered by the gminas of Borowa, Gawłuszowice, Łubnice, Osiek and Rytwiany.
References
- 1 2 3 4 5 6 7 8 9 "Local Data Bank (Bank Danych Lokalnych) – Layout by NTS nomenclature (Układ wg klasyfikacji NTS)". demografia.stat.gov.pl: GUS. 10 March 2011.
- ↑ "Połaniec – miasto, gmina, powiat staszowski, województwo świętokrzyskie" [Połaniec – urban area, commune, Staszów County, Świętokrzyskie Province, Poland]. Topographical map prepared in 1:10,000 scale. Aerial and satellite orthophotomap (in Polish). Head Office of Geodesy and Cartography, Poland, Warsaw. 2011. geoportal.gov.pl. Archived from the original on 21 December 2012. Retrieved 27 April 2011.
- ↑ "Połaniec – obszar wiejski, gmina, powiat staszowski, województwo świętokrzyskie" [Połaniec – rural area, commune, Staszów County, Świętokrzyskie Province, Poland]. Topographical map prepared in 1:10,000 scale. Aerial and satellite orthophotomap (in Polish). Head Office of Geodesy and Cartography, Poland, Warsaw. 2011. geoportal.gov.pl. Archived from the original on 21 December 2012. Retrieved 27 April 2011.


