Han Pijesak
Хан Пијесак | |
|---|---|
Town and municipality | |
 Han Pijesak | |
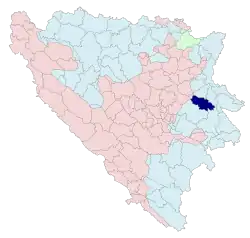
 Location of Han Pijesak within Bosnia and Herzegovina | |
 | |
| Coordinates: 44°05′N 18°57′E / 44.083°N 18.950°E | |
| Country | |
| Entity | |
| Government | |
| • Municipal mayor | Slobodan Đurić (SDS) |
| Area | |
| • Total | 322.9 km2 (124.7 sq mi) |
| Population (2013 census) | |
| • Total | 3,530 |
| • Density | 11/km2 (28/sq mi) |
| Time zone | UTC+1 (CET) |
| • Summer (DST) | UTC+2 (CEST) |
| Area code | 57 |
| Website | www |
Han Pijesak (Serbian Cyrillic: Хан Пијесак) is a town and municipality of Bosnia and Herzegovina, located in the Republika Srpska entity. As of 2013, it has a population of 3,530 inhabitants, while the town of Han Pijesak has a population of 2,018 inhabitants.
Settlements
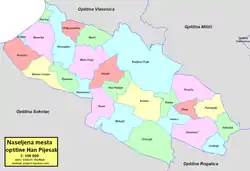
Aside from the town of Han Pijesak, the municipality consists of the following settlements:
Demographics
Population
| Population of settlements – Han Pijesak municipality | |||||
|---|---|---|---|---|---|
| Setllement | 1971. | 1981. | 1991. | 2013. | |
| Total | 7,804 | 6,879 | 6,348 | 3,530 | |
| 1 | Han Pijesak | 1,487 | 1,695 | 2,117 | 1,820 |
| 2 | Japaga | 152 | 210 | ||
| 3 | Kraljevo Polje | 349 | 402 | ||
| 4 | Džimrije | 207 | 134 | ||
| 5 | Mrkalji | 141 | 109 | ||
| 6 | Nevačka | 334 | 109 | ||
| 7 | Kusače | 135 | 88 | ||
| 8 | Podžeplje | 319 | 89 | ||
| 9 | Gođenje | 580 | 78 | ||
| 10 | Kram | 102 | 62 | ||
| 11 | Malo Polje | 121 | 60 | ||
| 12 | Pjenovac | 128 | 54 | ||
| 13 | Stoborani | 247 | 47 | ||
| 14 | Rijeke | 130 | 37 | ||
| 15 | Jelovci | 76 | 32 | ||
| 16 | Ravanjsko | 57 | 33 | ||
Ethnic composition

Stećak found in Han Pijesak, a part of a medieval fortress
.jpg.webp)
Postcard from Austro-Hungarian era

PM Milan Stojadinović in the city

Villa of king Alexander I of Yugoslavia

Waterfall in Žeravice

Landscape from Han Pijesak

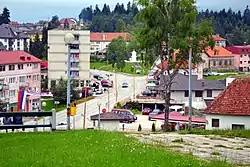
City centre

Pjenovac monastery
| Ethnic composition – Han Pijesak town | |||||||
|---|---|---|---|---|---|---|---|
| 2013. | 1991. | 1981. | 1971. | ||||
| Total | 1,820 (100,0%) | 2,117 (100,0%) | 1,695 (100,0%) | 1,487 (100,0%) | |||
| Serbs | 1807 (99.3%) | 1,873 (88,47%) | 1,413 (83,36%) | 1,326 (89,17%) | |||
| Bosniaks | 0 (0%) | 148 (6,991%) | 82 (4,838%) | 108 (7,263%) | |||
| Yugoslavs | 55 (2,598%) | 160 (9,440%) | 3 (0,202%) | ||||
| Others | 7 (0.4%) | 38 (1,795%) | 9 (0,531%) | 6 (0,403%) | |||
| Croats | 4 (0.2%) | 3 (0,142%) | 3 (0,177%) | 4 (0,269%) | |||
| Montenegrins | 17 (1,003%) | 19 (1,278%) | |||||
| Albanians | 9 (0,531%) | 11 (0,740%) | |||||
| Macedonians | 2 (0,118%) | 6 (0,403%) | |||||
| Slovenes | 4 (0,269%) | ||||||
| Ethnic composition – Han Pijesak municipality | |||||||
|---|---|---|---|---|---|---|---|
| 2013. | 1991. | 1981. | 1971. | ||||
| Total | 3,530 (100,0%) | 6,348 (100,0%) | 6,879 (100,0%) | 7,804 (100,0%) | |||
| Serbs | 3,068 (86,91%) | 3,674 (57,88%) | 3,927 (57,09%) | 4,790 (61,38%) | |||
| Bosniaks | 431 (12,21%) | 2,543 (40,06%) | 2,666 (38,76%) | 2,921 (37,43%) | |||
| Others | 24 (0,680%) | 56 (0,882%) | 18 (0,262%) | 11 (0,141%) | |||
| Croats | 7 (0,198%) | 7 (0,110%) | 9 (0,131%) | 16 (0,205%) | |||
| Yugoslavs | 68 (1,071%) | 222 (3,227%) | 7 (0,090%) | ||||
| Montenegrins | 24 (0,349%) | 28 (0,359%) | |||||
| Albanians | 9 (0,131%) | 19 (0,243%) | |||||
| Macedonians | 3 (0,044%) | 8 (0,103%) | |||||
| Slovenes | 1 (0,015%) | 4 (0,051%) | |||||
Economy
The following table gives a preview of total number of registered people employed in legal entities per their core activity (as of 2018):[1]
| Activity | Total |
|---|---|
| Agriculture, forestry and fishing | 437 |
| Mining and quarrying | 1 |
| Manufacturing | 100 |
| Electricity, gas, steam and air conditioning supply | 15 |
| Water supply; sewerage, waste management and remediation activities | 25 |
| Construction | 16 |
| Wholesale and retail trade, repair of motor vehicles and motorcycles | 40 |
| Transportation and storage | 32 |
| Accommodation and food services | 21 |
| Information and communication | 2 |
| Financial and insurance activities | 6 |
| Real estate activities | - |
| Professional, scientific and technical activities | 3 |
| Administrative and support service activities | 1 |
| Public administration and defense; compulsory social security | 105 |
| Education | 37 |
| Human health and social work activities | 28 |
| Arts, entertainment and recreation | 14 |
| Other service activities | 2 |
| Total | 884 |
See also
References
- ↑ "Cities and Municipalities of Republika Srpska" (PDF). rzs.rs.ba. Republika Srspka Institute of Statistics. 25 December 2019. Retrieved 31 December 2019.
External links
Wikimedia Commons has media related to Han Pijesak.
This article is issued from Wikipedia. The text is licensed under Creative Commons - Attribution - Sharealike. Additional terms may apply for the media files.
