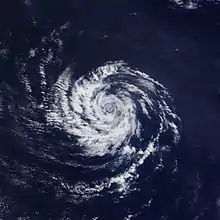
Mesoscale meteorology is the study of weather systems and processes at scales smaller than synoptic-scale systems but larger than microscale and storm-scale. Horizontal dimensions generally range from around 5 kilometres (3 mi) to several hundred kilometers. Examples of mesoscale weather systems are sea breezes, squall lines, and mesoscale convective complexes.
Vertical velocity often equals or exceeds horizontal velocities in mesoscale meteorological systems due to nonhydrostatic processes such as buoyant acceleration of a rising thermal or acceleration through a narrow mountain pass.
Classification

The earliest networks of weather observations in the late 1800s and early 1900s could detect the movement and evolution of larger, synoptic-scale systems like high and low-pressure areas. However, smaller and potentially hazardous meteorological phenomena were not well-captured by the sparse observation networks. The emergence of weather radar in the mid-1900s and an improved understanding of thunderstorm behavior led to a increased recognition of a need to study phenomena between the scales studied in the extant disciplines of microscale and synoptic-scale meteorology.[1] The term "mesoscale" originated from M. G. H. Ligda at the Massachusetts Institute of Technology, who suggested a need to study phenomena at such scales in 1951:[1][2]
It is anticipated that radar will provide useful information concerning the structure and behavior of that portion of the atmosphere which is not covered by either micro- or synoptic-meteorological studies. We have already observed with radar that precipitation formulations which are undoubtedly of significance occur on a scale too gross to be observed from a single station, yet too small to appear even on sectional synoptic charts. Phenomena of this size might well be designated as mesometeorological.
— M. G. H. Ligda, "Radar Storm Observation", Compendium of Meteorology (1951)[3]
Subclasses
Mesoscale meteorology broadly concerns meteorological phenomena larger than a few kilometers across but smaller than could be resolved by the observation networks used in the earliest standardized weather maps.[4] The mesoscale regime is often divided into these subclasses based on the size of associated weather systems:[5]
- Meso-alpha (meso-α) – 200–2000 km scale of phenomena like fronts, squall lines, mesoscale convective systems (MCS), tropical cyclones at the smaller edge of synoptic scale.[5]
- Meso-beta (meso-β) – 20–200 km scale of phenomena like mesocyclones, sea breezes, and lake effect snow storms.[5] Mesocale often refers to meso-β scale specifically.[6]
- Meso-gamma (meso-γ) – 2–20 km scale of phenomena like thunderstorm convection, complex terrain flows (at the edge to microscale, also known as storm-scale)
As a note, tropical and subtropical cyclones are classified by National Hurricane Center as synoptic scale rather than mesoscale.[7]
Dynamics

Mesoscale processes are characterized by having a relatively large Rossby number. Thus, over shorter distances as implicated in mesoscale phenomena, the importance of geostrophic balance and the Earth's rotation in shaping atmospheric processes is small relative to synoptic scale phenomena. Because the curvature of Earth is small at mesoscales, the physical models used to diagnose mesoscale phenomena often assume a constant Coriolis frequency.[8] Nonetheless, the Coriolis force is non-negligible and comparable to the influence of atmospheric buoyancy.[6] Large-scale turbulence and eddies also play a large role in mesoscale meteorology.[8] The vertical movement of air (expressed as omega) is larger at mesoscale than at synoptic scales, and the distribution of air pressure tends to be influenced by the behavior of winds at the mesoscale (as opposed to the converse at synoptic scales).[6]
Mesoscale boundaries
As in synoptic frontal analysis, mesoscale analysis uses cold, warm, and occluded fronts on the mesoscale to help describe phenomena. On weather maps mesoscale fronts are depicted as smaller and with twice as many bumps or spikes as the synoptic variety. In the United States, opposition to the use of the mesoscale versions of fronts on weather analyses, has led to the use of an overarching symbol (a trough symbol) with a label of outflow boundary as the frontal notation.[9]
See also
References
- 1 2 Trapp, Robert J. (2013). Mesoscale-Convective Processes in the Atmosphere. Cambridge: Cambridge University Press. ISBN 978-0-521-88942-1.
- ↑ Fujita 1986, p. 23.
- ↑ Ligda, Myron G. H. (1951). "Radar Storm Observation". Compendium of Meteorology: 1265–1282. doi:10.1007/978-1-940033-70-9_103.
- ↑ Markowski, Paul; Richardson, Yvette (2010). Mesoscale Meteorology in Midlatitudes. Chichester: Wiley-Blackwell. ISBN 978-0-470-74213-6.
- 1 2 3 Orlanski, I. (1975). "A rational subdivision of scales for atmospheric processes" (PDF). Bulletin of the American Meteorological Society. 56 (5): 527–530.
- 1 2 3 Shou, Shaowen; Li, Shenshen; Shou, Yixuan; Yao, Xiuping (2023). An Introduction to Mesoscale Meteorology. Singapore: Springer Nature Singapore. doi:10.1007/978-981-19-8606-2. ISBN 978-981-19-8605-5.
- ↑ "Glossary of NHC Terms".
- 1 2 Parker, D.J. (2015). "Mesoscale Meteorology | Overview". Encyclopedia of Atmospheric Sciences: 316–322. doi:10.1016/B978-0-12-382225-3.00478-3.
- ↑ Roth, David. "Unified Surface Analysis Manual" (PDF). Hydrometeorological Prediction Center. Retrieved 2006-10-24.
- Fujita, T.T. (1986). "Mesoscale classifications: their history and their application to forecasting". In Ray, P.S. (ed.). Mesoscale Meteorology and Forecasting. Boston: American Meteorological Society. pp. 18–35.
