Miami, Texas | |
|---|---|
 Looking north through Miami along Main Street | |
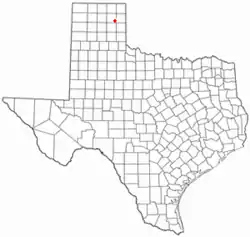
 Location of Miami, Texas | |
 | |
| Coordinates: 35°41′32″N 100°38′30″W / 35.69222°N 100.64167°W | |
| Country | United States |
| State | Texas |
| County | Roberts |
| Area | |
| • Total | 1.17 sq mi (3.03 km2) |
| • Land | 1.17 sq mi (3.03 km2) |
| • Water | 0.00 sq mi (0.00 km2) |
| Elevation | 2,736 ft (834 m) |
| Population (2010) | |
| • Total | 597 |
| • Estimate (2019)[3] | 550 |
| • Density | 470.49/sq mi (181.60/km2) |
| Time zone | UTC−6 (Central (CST)) |
| • Summer (DST) | UTC−5 (CDT) |
| ZIP code | 79059 |
| Area code | 806 |
| FIPS code | 48-47988 [4] |
| GNIS feature ID | 2411094[2] |
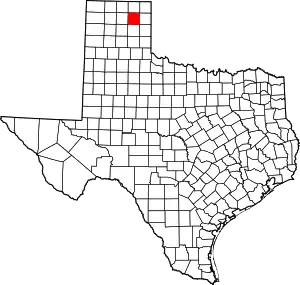
Miami (/maɪˈæmə/ my-AM-ə)[5] is a town in Roberts County, Texas, United States. It is part of the Pampa, Texas micropolitan statistical area. Its population was 597 at the 2010 census. It is the county seat of Roberts County[6] and the only municipality in the county.
Geography

Climate
| Climate data for Miami, Texas (1981–2010 normals) | |||||||||||||
|---|---|---|---|---|---|---|---|---|---|---|---|---|---|
| Month | Jan | Feb | Mar | Apr | May | Jun | Jul | Aug | Sep | Oct | Nov | Dec | Year |
| Record high °F (°C) | 83 (28) |
85 (29) |
92 (33) |
98 (37) |
103 (39) |
108 (42) |
107 (42) |
104 (40) |
104 (40) |
99 (37) |
88 (31) |
80 (27) |
108 (42) |
| Mean daily maximum °F (°C) | 49.0 (9.4) |
52.3 (11.3) |
60.6 (15.9) |
69.8 (21.0) |
78.1 (25.6) |
86.4 (30.2) |
91.4 (33.0) |
90.2 (32.3) |
82.4 (28.0) |
71.5 (21.9) |
59.5 (15.3) |
48.7 (9.3) |
69.9 (21.1) |
| Mean daily minimum °F (°C) | 23.1 (−4.9) |
26.0 (−3.3) |
32.9 (0.5) |
41.5 (5.3) |
51.9 (11.1) |
61.1 (16.2) |
66.1 (18.9) |
65.3 (18.5) |
57.0 (13.9) |
44.9 (7.2) |
33.0 (0.6) |
23.9 (−4.5) |
43.9 (6.6) |
| Record low °F (°C) | −4 (−20) |
−7 (−22) |
3 (−16) |
17 (−8) |
30 (−1) |
45 (7) |
51 (11) |
47 (8) |
31 (−1) |
12 (−11) |
8 (−13) |
−8 (−22) |
−8 (−22) |
| Average precipitation inches (mm) | 0.69 (18) |
0.70 (18) |
1.63 (41) |
2.04 (52) |
2.98 (76) |
3.64 (92) |
2.71 (69) |
2.77 (70) |
2.12 (54) |
2.01 (51) |
1.05 (27) |
0.88 (22) |
23.22 (590) |
| Average snowfall inches (cm) | 4.0 (10) |
3.8 (9.7) |
3.6 (9.1) |
0.9 (2.3) |
0.2 (0.51) |
0 (0) |
0 (0) |
0 (0) |
0 (0) |
0.1 (0.25) |
1.3 (3.3) |
5.1 (13) |
19 (48) |
| Source: National Weather Service[7] | |||||||||||||
Demographics
| Census | Pop. | Note | %± |
|---|---|---|---|
| 1920 | 935 | — | |
| 1930 | 953 | 1.9% | |
| 1940 | 713 | −25.2% | |
| 1950 | 646 | −9.4% | |
| 1960 | 656 | 1.5% | |
| 1970 | 611 | −6.9% | |
| 1980 | 813 | 33.1% | |
| 1990 | 675 | −17.0% | |
| 2000 | 588 | −12.9% | |
| 2010 | 597 | 1.5% | |
| 2019 (est.) | 550 | [3] | −7.9% |
| U.S. Decennial Census[8] | |||
2020 census
| Race | Number | Percentage |
|---|---|---|
| White (NH) | 456 | 84.6% |
| Native American or Alaska Native (NH) | 2 | 0.37% |
| Some Other Race (NH) | 1 | 0.19% |
| Mixed/Multi-Racial (NH) | 41 | 7.61% |
| Hispanic or Latino | 39 | 7.24% |
| Total | 539 |
As of the 2020 United States census, there were 539 people, 197 households, and 137 families residing in the city.
2000 census
At the 2000 census, 588 people, 242 households, and 173 families were living in the city. The population density was 504.0 people/sq mi (194.0/km2). There were 283 housing units at an average density of 242.6 per square mile (93.7/km2). The racial makeup of the city was 95.75% White, 0.85% Native American, 0.17% Asian, 1.53% from other races, and 1.70% from two or more races. Hispanic or Latino of any race were 3.57%.[4]
Of the 242 households, 31.8% had children under the age of 18 living with them, 65.7% were married couples living together, 4.5% had a female householder with no husband present, and 28.1% were not families. About 27.7% of households were one person and 13.2% were one person aged 65 or older. The average household size was 2.43 and the average family size was 2.97.
The age distribution was 26.0% under the age of 18, 5.1% from 18 to 24, 24.1% from 25 to 44, 29.1% from 45 to 64, and 15.6% 65 or older. The median age was 42 years. For every 100 females, there were 95.3 males. For every 100 females age 18 and over, there were 94.2 males.
The median income for a household was $38,875 and for a family was $47,656. Males had a median income of $36,250 versus $22,222 for females. The per capita income for the city was $18,585. About 4.6% of families and 8.8% of the population were below the poverty line, including 9.7% of those under age 18 and 7.5% of those age 65 or over.
Education
Donna Gill is the superintendent Miami Independent School District.[11] Prekindergarten through 12th grade are taught in one building. Miami High School currently provides Spanish to seven area schools via the Texas Virtual School program.
References
- ↑ "2019 U.S. Gazetteer Files". United States Census Bureau. Retrieved August 7, 2020.
- 1 2 U.S. Geological Survey Geographic Names Information System: Miami, Texas
- 1 2 "Population and Housing Unit Estimates". United States Census Bureau. May 24, 2020. Retrieved May 27, 2020.
- 1 2 "U.S. Census website". United States Census Bureau. Retrieved January 31, 2008.
- ↑ "Towns M Texas Pronunciation Guide". www.texastripper.com. Archived from the original on February 13, 2008.
- ↑ "Find a County". National Association of Counties. Retrieved June 7, 2011.
- ↑ "National Weather Service". August 2013.
- ↑ "Census of Population and Housing". Census.gov. Retrieved June 4, 2015.
- ↑ "Explore Census Data". data.census.gov. Retrieved May 18, 2022.
- ↑ "About the Hispanic Population and its Origin". www.census.gov. Retrieved May 18, 2022.
- ↑ "Miami ISD - Miami ISD". www.miamiisd.net. Archived from the original on August 21, 2014.
External links
- Miami, Texas
- Miami, Texas from the Handbook of Texas Online
