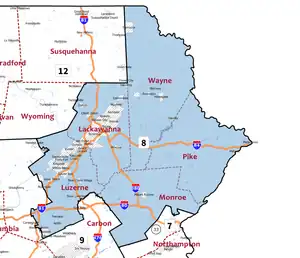
| Pennsylvania's 8th congressional district | |||
|---|---|---|---|
Interactive map of district boundaries since January 3, 2023 | |||
| Representative |
| ||
| Population (2022) | 766,586 | ||
| Median household income | $63,172 | ||
| Ethnicity |
| ||
| Cook PVI | R+4[1] | ||
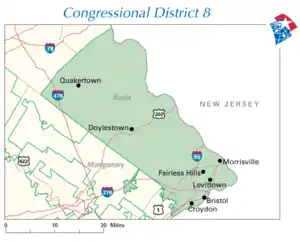
Pennsylvania's 8th congressional district is located in the northeastern region of the state. It encompasses all of Wayne, Pike, and Lackawanna Counties; along with portions of Luzerne and Monroe counties.
The district had been anchored in Bucks County from the 1940s until 2018, even as most other districts in Pennsylvania changed drastically during that time frame due to population shifts and Pennsylvania's loss of seats in the House.[2]
The Supreme Court of Pennsylvania redrew the district in February 2018 after ruling the previous map unconstitutional due to gerrymandering. The 8th district was reassigned to the northeastern part of the state for the 2018 elections and representation thereafter. It is geographically the successor of the former 17th district, including the ancestrally Democratic cities of Scranton and Wilkes-Barre in the Wyoming Valley. Portions of the new 8th district also came from the old 10th district, including the more conservative counties of Pike and Wayne. Meanwhile, the Bucks County district was renumbered as the 1st district.[3]
The district has a Cook PVI of R+4;[1] however, the Democratic incumbent of the old 17th district, Matt Cartwright, won in 2018.[4] It was one of five districts that would have voted for Donald Trump in the 2020 presidential election had they existed in their current configuration while being won or held by a Democrat in 2022.
The district is a mix of suburban and rural communities. It is predominantly white and middle-class. The bulk of its population is located in the ancestrally Democratic cities of Scranton and Wilkes-Barre. However, the Democrats in this district are populist leaning, different from their counterparts in Philadelphia and Pittsburgh. The old 17th swung from a 55–43 win for Barack Obama to a 54–43 win for Donald Trump, the first time much of this area had voted for a Republican since 1988. Now this is the most Republican-leaning district held by a member of Congressional Progressive Caucus based on the Cook Partisan Voting Index.
Recent statewide election results
| Year | Office | Result |
|---|---|---|
| 2020 | President | Trump 51–47% |
| 2022 | Governor | Shapiro 54–44% |
| 2022 | Senate | Fetterman 49–48% |
List of members representing the district
The district was created in 1791.
1791–1793: one seat
| Representative | Party | Years | Cong ress |
Electoral history |
|---|---|---|---|---|
| District first established March 4, 1791 | ||||
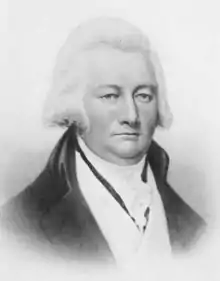
 William Findley (Youngstown) |
Anti-Administration | March 4, 1791 – March 3, 1793 |
2nd | Elected in 1791. Redistricted to the at-large district. |
District eliminated in 1793 and replaced by the at-large district.
1795–1813: one seat
District restored in 1795.
1823–1833: two seats
1833–present: one seat
Election results
| Party | Candidate | Votes | % | ±% | |
|---|---|---|---|---|---|
| Republican | Mike Fitzpatrick | 183,229 | 55 | -9 | |
| Democratic | Virginia Schrader | 143,427 | 44 | +7 | |
| Libertarian | Arthur L. Farnsworth | 3,710 | 1 | +1 | |
| Constitution | Erich Lukas | 898 | 0.3 | +0.3 | |
| Turnout | 331,264 | ||||
| Party | Candidate | Votes | % | ±% | |
|---|---|---|---|---|---|
| Democratic | Patrick Murphy | 125,667 | 50 | +6 | |
| Republican | Mike Fitzpatrick (incumbent) | 124,146 | 50 | -5 | |
| Turnout | 249,813 | ||||
| Party | Candidate | Votes | % | ±% | |
|---|---|---|---|---|---|
| Democratic | Patrick Murphy (incumbent) | 197,869 | 57 | +7 | |
| Republican | Tom Manion | 145,103 | 42 | -8 | |
| Independent | Tom Lingenfelter | 5,543 | 2 | ||
| Turnout | 348,515 | ||||
| Party | Candidate | Votes | % | ±% | |
|---|---|---|---|---|---|
| Republican | Mike Fitzpatrick | 126,404 | 54 | +12 | |
| Democratic | Patrick Murphy (incumbent) | 109,157 | 46 | -11 | |
| Turnout | 235,561 | ||||
| Party | Candidate | Votes | % | ±% | |
|---|---|---|---|---|---|
| Republican | Mike Fitzpatrick (incumbent) | 199,379 | 56.6 | +2.6 | |
| Democratic | Kathy Boockvar | 152,859 | 43.4 | -2.6 | |
| Turnout | 352,238 | ||||
| Party | Candidate | Votes | % | ±% | |
|---|---|---|---|---|---|
| Republican | Mike Fitzpatrick (Incumbent) | 137,731 | 61.90 | ||
| Democratic | Kevin Strouse | 84,767 | 38.10 | ||
| Turnout | 222,498 | ||||
| Party | Candidate | Votes | % | |
|---|---|---|---|---|
| Republican | Brian Fitzpatrick | 207,263 | 54.4 | |
| Democratic | Steve Santarsiero | 173,555 | 45.6 | |
| Total votes | 380,818 | 100.0 | ||
| Republican hold | ||||
| Party | Candidate | Votes | % | |
|---|---|---|---|---|
| Democratic | Matt Cartwright (incumbent) | 135,603 | 54.6 | |
| Republican | John Chrin | 112,563 | 45.4 | |
| Total votes | 248,166 | 100.0 | ||
| Democratic hold | ||||
| Party | Candidate | Votes | % | |
|---|---|---|---|---|
| Democratic | Matt Cartwright (incumbent) | 178,004 | 51.8 | |
| Republican | Jim Bognet | 165,783 | 48.2 | |
| Total votes | 343,787 | 100.0 | ||
| Democratic hold | ||||
| Party | Candidate | Votes | % | |
|---|---|---|---|---|
| Democratic | Matt Cartwright (incumbent) | 146,956 | 51.2 | |
| Republican | Jim Bognet | 139,930 | 48.8 | |
| Total votes | 286,886 | 100.0 | ||
| Democratic hold | ||||
See also
References
- 1 2 "2022 Cook PVI: District Map and List". Cook Political Report. Retrieved January 10, 2023.
- ↑ "Congressional Interactive District Map". Retrieved August 30, 2016.
- ↑ Cohn, Nate; Bloch, Matthew; Quealy, Kevin (February 19, 2018). "The New Pennsylvania House Districts Are In. We Review the Mapmakers' Choices". The Upshot. The New York Times. Retrieved February 20, 2018.
- ↑ "Battle for the House 2018". Real Clear Politics. Retrieved May 4, 2018.
- ↑ "2012 General Election—Official Returns". Pennsylvania Department of State. November 6, 2012. Archived from the original on November 16, 2012. Retrieved January 1, 2013.
- 1 2 "Pennsylvania 2014 General Election - November 4, 2014 Official Results". Pennsylvania Secretary of State. November 4, 2014. Archived from the original on February 15, 2015. Retrieved January 16, 2015.
- ↑ "2020 Presidential Election - Representative in Congress". Pennsylvania Department of State. Retrieved November 25, 2020.
- ↑ "2022 General Election Official Returns - Representative in Congress". Pennsylvania Department of State.
- Martis, Kenneth C. (1989). The Historical Atlas of Political Parties in the United States Congress. New York: Macmillan Publishing Company.
- Martis, Kenneth C. (1982). The Historical Atlas of United States Congressional Districts. New York: Macmillan Publishing Company.
- Congressional Biographical Directory of the United States 1774–present
.svg.png.webp)







.jpg.webp)
.jpg.webp)
.jpg.webp)

.jpg.webp)
.jpg.webp)
.jpg.webp)


.jpg.webp)




.tif.png.webp)


