Saint-Martin-du-Puy | |
|---|---|
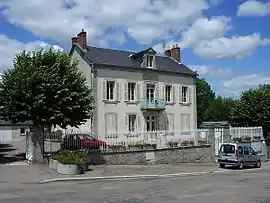
 The town hall in Saint-Martin-du-Puy | |
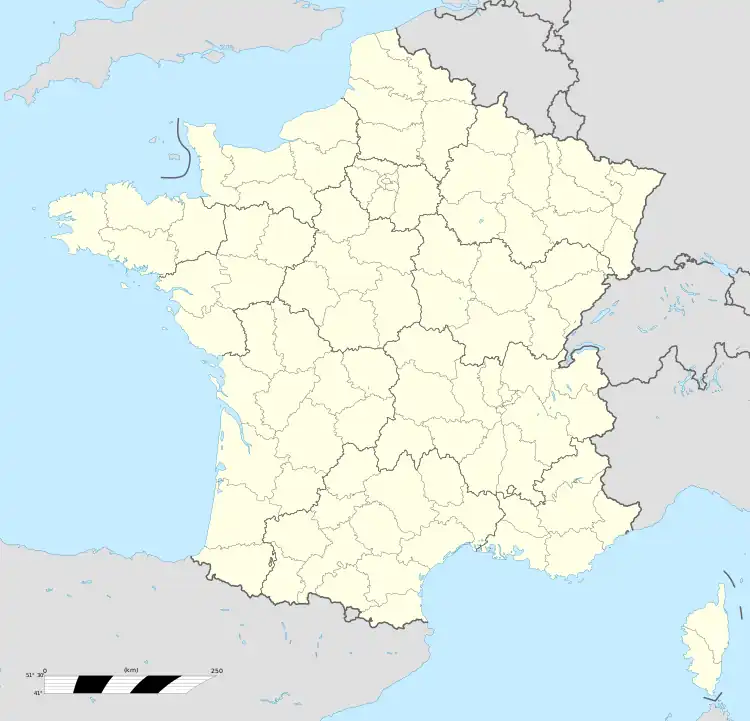
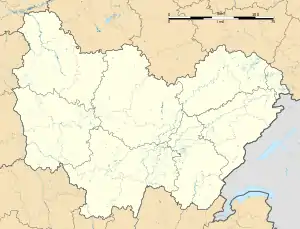
Location of Saint-Martin-du-Puy | |
 Saint-Martin-du-Puy  Saint-Martin-du-Puy | |
| Coordinates: 47°20′07″N 3°52′07″E / 47.3353°N 3.8686°E | |
| Country | France |
| Region | Bourgogne-Franche-Comté |
| Department | Nièvre |
| Arrondissement | Château-Chinon (Ville) |
| Canton | Corbigny |
| Intercommunality | CC Morvan Sommets et Grands Lacs |
| Government | |
| • Mayor (2020–2026) | Jean-Luc Vieren[1] |
| Area 1 | 30.70 km2 (11.85 sq mi) |
| Population | 285 |
| • Density | 9.3/km2 (24/sq mi) |
| Time zone | UTC+01:00 (CET) |
| • Summer (DST) | UTC+02:00 (CEST) |
| INSEE/Postal code | 58255 /58140 |
| Elevation | 316–598 m (1,037–1,962 ft) |
| 1 French Land Register data, which excludes lakes, ponds, glaciers > 1 km2 (0.386 sq mi or 247 acres) and river estuaries. | |
Saint-Martin-du-Puy (French pronunciation: [sɛ̃ maʁtɛ̃ dy pɥi]) is a commune in the Nièvre department in central France.[3]
Saint Martin du Puy is a small commune encompassing 8 villages in central France (Bourgogne-Franche-Comté). Plainfas is the most populated village and sits next to a beautiful lake called Lac du Caumecon. Not far from the lake is one of the best canoe and kayaking places in France where national and international competitions are held. It is also a great place for white water rafting.
In the village of Saint martin du Puy, There is a boulangerie, small bar/country restaurant, post office and Inn. The only main industry in Saint Martin is a lumber yard which makes wooden pallets.
The village is situated on a hill in the middle of a National Park called the Morvan. It is a very old village and rumor has it that it dates back to 500 BC. There are some interesting legends surrounding the village and there are dolmens in the vicinity. There is a beautiful chateau in Vesigneux (3 km from the village) which is still owned by the Bourbon family (one of the oldest French noble families)
Demographics
| Year | Pop. | ±% p.a. |
|---|---|---|
| 1968 | 526 | — |
| 1975 | 392 | −4.11% |
| 1982 | 375 | −0.63% |
| 1990 | 314 | −2.19% |
| 1999 | 281 | −1.23% |
| 2009 | 289 | +0.28% |
| 2014 | 277 | −0.84% |
| 2020 | 283 | +0.36% |
| Source: INSEE[4] | ||
See also
References
- ↑ "Répertoire national des élus: les maires" (in French). data.gouv.fr, Plateforme ouverte des données publiques françaises. 13 September 2022.
- ↑ "Populations légales 2021". The National Institute of Statistics and Economic Studies. 28 December 2023.
- ↑ INSEE commune file
- ↑ Population en historique depuis 1968, INSEE
External links
- Saint-Martin-du-Puy, Patrimoine du Morvan