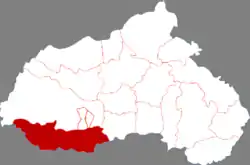
Shahe
沙河市 Shaho | |
|---|---|
 Shahe in Xingtai | |
 Shahe Location in Hebei | |
| Coordinates: 36°51′18″N 114°30′12″E / 36.8549°N 114.5033°E | |
| Country | People's Republic of China |
| Province | Hebei |
| Prefecture-level city | Xingtai |
| Area | |
| • County-level city | 999.0 km2 (385.7 sq mi) |
| • Urban | 37.00 km2 (14.29 sq mi) |
| Population (2017) | |
| • County-level city | 457,000 |
| • Urban | 96,500 |
| Time zone | UTC+8 (China Standard) |
Shahe (Chinese: 沙河; pinyin: Shāhé) is a county-level city in the prefecture-level city of Xingtai, in the southern part of Hebei province, China.
Shahe has been called China's "glass capital." Its glass factories manufacture about ten percent of the world supply of flat glass. About 50,000 of Shahe's 480,000 residents work in the glass industry.
Smog in Shahe has become a serious problem, with some factories preferring to pay fines rather than comply with air pollution enforcement requirements.[2]
Administrative divisions
[3] Subdistricts:
- Dalian Subdistrict (褡裢街道), Qiaodong Subdistrict (桥东街道), Qiaoxi Subdistrict (桥西街道), Zanshan Subdistrict (赞善街道), Zhouzhuang Subdistrict (周庄街道)
Towns:
- Shahecheng (沙河城镇), Xincheng (新城镇), Baita (白塔镇), Shiliting (十里亭镇), Qicun (綦村镇
Townships:
- Liucun Township (留村乡), Cejing Township (册井乡), Liushigang Township (刘石岗乡), Chaiguan Township (柴关乡), Chanfang Township (蝉房乡)
Climate
| Climate data for Shahe (1991–2020 normals, extremes 1981–2010) | |||||||||||||
|---|---|---|---|---|---|---|---|---|---|---|---|---|---|
| Month | Jan | Feb | Mar | Apr | May | Jun | Jul | Aug | Sep | Oct | Nov | Dec | Year |
| Record high °C (°F) | 19.3 (66.7) |
26.9 (80.4) |
32.8 (91.0) |
36.5 (97.7) |
38.2 (100.8) |
44.4 (111.9) |
41.7 (107.1) |
36.3 (97.3) |
38.9 (102.0) |
33.9 (93.0) |
27.8 (82.0) |
27.8 (82.0) |
44.4 (111.9) |
| Mean daily maximum °C (°F) | 4.0 (39.2) |
8.4 (47.1) |
15.2 (59.4) |
21.7 (71.1) |
27.4 (81.3) |
32.6 (90.7) |
32.4 (90.3) |
30.5 (86.9) |
27.2 (81.0) |
21.4 (70.5) |
12.4 (54.3) |
5.7 (42.3) |
19.9 (67.8) |
| Daily mean °C (°F) | −2.4 (27.7) |
1.5 (34.7) |
8.2 (46.8) |
15.0 (59.0) |
20.9 (69.6) |
26.1 (79.0) |
27.2 (81.0) |
25.4 (77.7) |
20.8 (69.4) |
14.6 (58.3) |
5.9 (42.6) |
−0.5 (31.1) |
13.6 (56.4) |
| Mean daily minimum °C (°F) | −7.2 (19.0) |
−3.9 (25.0) |
2.1 (35.8) |
8.7 (47.7) |
14.5 (58.1) |
19.9 (67.8) |
22.7 (72.9) |
21.2 (70.2) |
15.7 (60.3) |
9.2 (48.6) |
1.0 (33.8) |
−5 (23) |
8.2 (46.8) |
| Record low °C (°F) | −21.0 (−5.8) |
−22.3 (−8.1) |
−10.2 (13.6) |
−3.6 (25.5) |
2.1 (35.8) |
10.0 (50.0) |
16.1 (61.0) |
12.0 (53.6) |
5.1 (41.2) |
−2.9 (26.8) |
−16.0 (3.2) |
−17.5 (0.5) |
−22.3 (−8.1) |
| Average precipitation mm (inches) | 2.6 (0.10) |
7.0 (0.28) |
7.8 (0.31) |
28.2 (1.11) |
39.5 (1.56) |
50.4 (1.98) |
162.2 (6.39) |
118.8 (4.68) |
46.2 (1.82) |
25.1 (0.99) |
14.4 (0.57) |
3.0 (0.12) |
505.2 (19.91) |
| Average precipitation days (≥ 0.1 mm) | 1.7 | 2.8 | 2.7 | 5.5 | 6.8 | 8.6 | 11.3 | 10.1 | 7.0 | 5.5 | 3.5 | 2.0 | 67.5 |
| Average snowy days | 2.7 | 2.8 | 0.8 | 0.2 | 0 | 0 | 0 | 0 | 0 | 0 | 1.4 | 2.5 | 10.4 |
| Average relative humidity (%) | 63 | 59 | 55 | 62 | 64 | 60 | 76 | 82 | 76 | 69 | 70 | 67 | 67 |
| Mean monthly sunshine hours | 139.2 | 155.3 | 202.2 | 225.2 | 248.8 | 218.1 | 183.4 | 182.6 | 177.6 | 177.6 | 148.7 | 144.7 | 2,203.4 |
| Percent possible sunshine | 45 | 50 | 54 | 57 | 57 | 50 | 41 | 44 | 48 | 52 | 49 | 48 | 50 |
| Source: China Meteorological Administration[4][5] | |||||||||||||
References
- 1 2 Ministry of Housing and Urban-Rural Development, ed. (2019). China Urban Construction Statistical Yearbook 2017. Beijing: China Statistics Press. p. 46. Retrieved 11 January 2020.
- ↑ Zhou, Viola (2017-09-21). "Grim news from front line of China's battle against air pollution". South China Morning Post. Retrieved 2017-09-26.
- ↑ 邢台市-行政区划网
- ↑ 中国气象数据网 – WeatherBk Data (in Simplified Chinese). China Meteorological Administration. Retrieved 25 August 2023.
- ↑ 中国气象数据网 (in Simplified Chinese). China Meteorological Administration. Retrieved 25 August 2023.
External links
This article is issued from Wikipedia. The text is licensed under Creative Commons - Attribution - Sharealike. Additional terms may apply for the media files.