| Stockton Formation | |
|---|---|
Stratigraphic range: | |
| Type | Formation |
| Unit of | Newark Supergroup |
| Underlies | Lockatong Formation |
| Lithology | |
| Primary | sandstone |
| Other | siltstone, mudstone |
| Location | |
| Region | Pennsylvania, New Jersey, and New York |
| Country | United States |
| Type section | |
| Named for | Stockton, New Jersey |
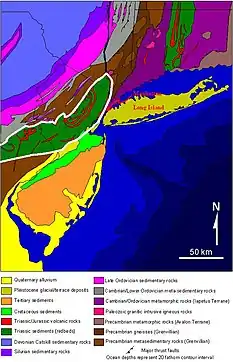
The Triassic Stockton Formation is a mapped bedrock unit in Pennsylvania, New Jersey, and New York. It is named after Stockton, New Jersey, where it was first described. It is laterally equivalent to the New Oxford Formation in the Gettysburg Basin of Pennsylvania and Maryland.[1]
Description
The Stockton is defined as a light-gray to light brown and yellowish medium to coarse grained sandstone and reddish to purplish-brown siltstone and mudstone with shale interbeds; and interbedded argillite. In New Jersey, feldspar pebbly sandstone and conglomerate, and quartz-pebble conglomerate are also mapped.[2]
Depositional environment
The Stockton is described as a bajada. The sediments were a result of the rifting of Pangea. The sediments came from the southeast from a largely granitic terrane and spread across an even plain.[1] Interfingered with the Stockton, the Lockatong Formation are lake sediments, which grew during wetter climatic cycles during the Late Triassic.[1]
Fossils
Some fossils found within the Stockton Formation are fossil ferns including Sphenopteris sitholeyi. (Virginia Museum of Natural History Guidebook, no 1, p83.)
Age
Relative age dating of the Stockton places it in the Upper Triassic System, i.e., deposition between 237 and 207 (±5) million years ago. It rests unconformably a top many different formations of the Appalachian Piedmont. It interfingers with the Lockatong Formation and also rests conformably below the Passaic Formation. There are numerous diabase intrusions into the Stockton with local contact metamorphic rocks.[3]
References
- 1 2 3 Faill, R.T., (2004). The Birdsboro Basin. Pennsylvania Geology V. 34 n. 4.
- ↑ Orndorff, R.C., et al., (1998). Bedrock Geologic Map of Central and Southern New Jersey. United States Geological Survey, Scale 1:100,000.
- ↑ Berg, T.M., et al., (1983). Stratigraphic Correlation Chart of Pennsylvania: G75, Pennsylvania Geological Survey, Harrisburg, Pennsylvania.
