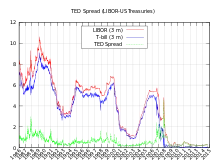

The TED spread is the difference between the interest rates on interbank loans and on short-term U.S. government debt ("T-bills"). TED is an acronym formed from T-Bill and ED, the ticker symbol for the Eurodollar futures contract.
Initially, the TED spread was the difference between the interest rates for three-month U.S. Treasuries contracts and the three-month Eurodollars contract as represented by the London Interbank Offered Rate (LIBOR). However, since the Chicago Mercantile Exchange dropped T-bill futures after the 1987 crash,[1] the TED spread is now calculated as the difference between the three-month LIBOR and the three-month T-bill interest rate.
Formula and reading
The size of the spread is usually denominated in basis points (bps). For example, if the T-bill rate is 5.10% and ED trades at 5.50%, the TED spread is 40 bps. The TED spread fluctuates over time but generally has remained within the range of 10 and 50 bps (0.1% and 0.5%) except in times of financial crisis. A rising TED spread often presages a downturn in the U.S. stock market, as it indicates that liquidity is being withdrawn.
Indicator of counterparty risk
The TED spread is an indicator of perceived credit risk in the general economy,[2] since T-bills are considered risk-free while LIBOR reflects the credit risk of lending to commercial banks. An increase in the TED spread is a sign that lenders believe the risk of default on interbank loans (also known as counterparty risk) is increasing. Interbank lenders, therefore, demand a higher rate of interest, or accept lower returns on safe investments such as T-bills. When the risk of bank defaults is considered to be decreasing, the TED spread decreases.[3] Boudt, Paulus, and Rosenthal show that a TED spread above 48 basis points is indicative of economic crisis.[4]
Historical levels
Highs
The long-term average of the TED spread has been 30 basis points with a maximum of 50 bps. During 2007, the subprime mortgage crisis ballooned the TED spread to a region of 150–200 bps. On September 17, 2008, the TED spread exceeded 300 bps, breaking the previous record set after the Black Monday crash of 1987.[5] Some higher readings for the spread were due to inability to obtain accurate LIBOR rates in the absence of a liquid unsecured lending market.[6] On October 10, 2008, the TED spread reached another new high of 457 basis points.
Lows
In October 2013, due to worries regarding a potential default on US debt, the 1-month TED went negative for the first time since tracking started.[7][8]
See also
References
- ↑ Asia Times
- ↑ Bloomberg.com Financial Glossary
- ↑ Mission not accomplished not yet, anyway - Paul Krugman - Op-Ed Columnist - New York Times Blog
- ↑ Boudt, K.; Paulus, E.; Rosenthal, D.W.R. (2017). "Funding liquidity, market liquidity and TED spread: A two-regime model". Journal of Empirical Finance. 43: 143–158. doi:10.1016/j.jempfin.2017.06.002. hdl:10419/144456.
- ↑ Financial Times. (2008). Panic grips credit markets
- ↑ Bloomberg - Libor Jumps as Banks Seek Cash to Shore Up Finances
- ↑ Obama Says Real Boss in Default Showdown Means Bonds Call Shots, Bloomberg.com, 11 October 2013
- ↑ UBS Asset Management Taps Derivatives to Hedge U.S. Debt Risk, Bloomberg.com, 10 October 2013
External links
- Current TED Spread Quote from StockCharts.com
- Betting the Bank
- Understanding the TED spread from the Econbrowser blog