| ||||||||||||||||||||||||||||||||||||||||||||||||||||||||||||||||||||
35 of the 100 seats in the United States Senate 51 seats needed for a majority | ||||||||||||||||||||||||||||||||||||||||||||||||||||||||||||||||||||
|---|---|---|---|---|---|---|---|---|---|---|---|---|---|---|---|---|---|---|---|---|---|---|---|---|---|---|---|---|---|---|---|---|---|---|---|---|---|---|---|---|---|---|---|---|---|---|---|---|---|---|---|---|---|---|---|---|---|---|---|---|---|---|---|---|---|---|---|---|
| ||||||||||||||||||||||||||||||||||||||||||||||||||||||||||||||||||||
 Results of the elections: Democratic gain Democratic hold Republican gain Republican hold Independent gain Conservative gain No election | ||||||||||||||||||||||||||||||||||||||||||||||||||||||||||||||||||||
| ||||||||||||||||||||||||||||||||||||||||||||||||||||||||||||||||||||
The 1970 United States Senate elections was an election for the United States Senate. It took place on November 3, with the 33 seats of Class 1 contested in regular elections. Special elections were also held to fill vacancies. These races occurred in the middle of Richard Nixon's first term as president. The Democrats lost a net of three seats, while the Republicans and the Conservative Party of New York picked up one net seat each, and former Democrat Harry F. Byrd Jr. was re-elected as an independent.
This was the first time that Republicans gained Senate seats while losing House seats, which also occurred in 2018. This also occurred for Democrats in 1914, 1962, and 2022.[3]
This was the most recent election in which a third party won a seat in the Senate until 2006. As of 2024, this is also the most recent cycle in which Democrats won Senate elections in Utah and Wyoming, and the most recent in which Republicans won a Senate election in Hawaii.
Results summary
| 54 | 1 | 1 | 44 |
| Democratic | I | C | Republican |
| Parties | Total | ||||||||||||||||||||||||||||||||||||||||||||||||||||||||||||||||||||||||||||||||||||||||||||||||||
|---|---|---|---|---|---|---|---|---|---|---|---|---|---|---|---|---|---|---|---|---|---|---|---|---|---|---|---|---|---|---|---|---|---|---|---|---|---|---|---|---|---|---|---|---|---|---|---|---|---|---|---|---|---|---|---|---|---|---|---|---|---|---|---|---|---|---|---|---|---|---|---|---|---|---|---|---|---|---|---|---|---|---|---|---|---|---|---|---|---|---|---|---|---|---|---|---|---|---|---|
| Democratic | Republican | Conservative | Independent | Other | |||||||||||||||||||||||||||||||||||||||||||||||||||||||||||||||||||||||||||||||||||||||||||||||
| Last elections (1968) | 58 | 42 | 0 | 0 | 0 | 100 | |||||||||||||||||||||||||||||||||||||||||||||||||||||||||||||||||||||||||||||||||||||||||||||
| Before these elections | 57 | 43 | 0 | 0 | 0 | 100 | |||||||||||||||||||||||||||||||||||||||||||||||||||||||||||||||||||||||||||||||||||||||||||||
| Not up | 32 | 33 | — | 0 | — | 65 | |||||||||||||||||||||||||||||||||||||||||||||||||||||||||||||||||||||||||||||||||||||||||||||
| Up | 25 | 10 | — | — | — | 35 | |||||||||||||||||||||||||||||||||||||||||||||||||||||||||||||||||||||||||||||||||||||||||||||
| Class 1 (1964→1970) | 25 | 8 | — | — | — | 33 | |||||||||||||||||||||||||||||||||||||||||||||||||||||||||||||||||||||||||||||||||||||||||||||
| Special: Class 2 | 0 | 1 | — | 0 | — | 1 | |||||||||||||||||||||||||||||||||||||||||||||||||||||||||||||||||||||||||||||||||||||||||||||
| Special: Class 3 | 0 | 1 | — | 0 | — | 1 | |||||||||||||||||||||||||||||||||||||||||||||||||||||||||||||||||||||||||||||||||||||||||||||
| Incumbent retired | 3 | 1 | — | 0 | — | 4 | |||||||||||||||||||||||||||||||||||||||||||||||||||||||||||||||||||||||||||||||||||||||||||||
| Held by same party | 2 | 1 | — | — | — | 3 | |||||||||||||||||||||||||||||||||||||||||||||||||||||||||||||||||||||||||||||||||||||||||||||
| Replaced by other party | — | — | — | 1 | |||||||||||||||||||||||||||||||||||||||||||||||||||||||||||||||||||||||||||||||||||||||||||||||
| Result | 2 | 2 | 0 | 0 | 0 | 4 | |||||||||||||||||||||||||||||||||||||||||||||||||||||||||||||||||||||||||||||||||||||||||||||
| Incumbent ran | 22[lower-alpha 2][lower-alpha 3] | 9[lower-alpha 3] | — | — | — | 31 | |||||||||||||||||||||||||||||||||||||||||||||||||||||||||||||||||||||||||||||||||||||||||||||
| Won re-election | 17 | 6[lower-alpha 4] | — | — | — | 23 | |||||||||||||||||||||||||||||||||||||||||||||||||||||||||||||||||||||||||||||||||||||||||||||
| Won re-election but changed party | — | 1 | |||||||||||||||||||||||||||||||||||||||||||||||||||||||||||||||||||||||||||||||||||||||||||||||||
| Lost re-election | — | — | 6 | ||||||||||||||||||||||||||||||||||||||||||||||||||||||||||||||||||||||||||||||||||||||||||||||||
| Lost renomination, but held by same party |
1 | 0 | — | — | — | 1 | |||||||||||||||||||||||||||||||||||||||||||||||||||||||||||||||||||||||||||||||||||||||||||||
| Result | 20 | 9 | 1 | 1 | 0 | 31 | |||||||||||||||||||||||||||||||||||||||||||||||||||||||||||||||||||||||||||||||||||||||||||||
| Total elected | 22 | 11 | 1 | 1 | 0 | 35 | |||||||||||||||||||||||||||||||||||||||||||||||||||||||||||||||||||||||||||||||||||||||||||||
| Net gain/loss | 2 | ||||||||||||||||||||||||||||||||||||||||||||||||||||||||||||||||||||||||||||||||||||||||||||||||||
| Nationwide vote | 25,435,247 | 19,373,972[lower-alpha 1] | 2,183,572 | 516,149 | 1,049,884 | 48,558,824 | |||||||||||||||||||||||||||||||||||||||||||||||||||||||||||||||||||||||||||||||||||||||||||||
| Share | 52.38% | 39.90% | 4.50% | 1.06% | 2.16% | 100% | |||||||||||||||||||||||||||||||||||||||||||||||||||||||||||||||||||||||||||||||||||||||||||||
| Result | 54 | 44 | 1 | 1 | 0 | 100 | |||||||||||||||||||||||||||||||||||||||||||||||||||||||||||||||||||||||||||||||||||||||||||||
Source: Office of the Clerk[1]
Getting out the vote
President Nixon said that rather than violent protests, the best way for the American public to get their opinion heard was by voting:
The most powerful four letter word is a clean word, it’s the most powerful four letter word in the history of men, it's called vote. V-O-T-E. My friends, I say that the answer to those that engage in disruption, to those that shout their filthy slogans, to those that try to shout down speakers, it's not to answer in kind, but go to the polls in election day, and in the quiet of that ballot box, stand up and be counted, the great silent majority of America.
Gains, losses, and holds
Retirements
One Republican and three Democrats retired instead of seeking re-election.
| State | Senator | Replaced by |
|---|---|---|
| Delaware | John J. Williams | William Roth |
| Florida | Spessard Holland | Lawton Chiles |
| Minnesota | Eugene McCarthy | Hubert Humphrey |
| Ohio | Stephen M. Young | Robert Taft Jr. |
Defeats
One Republican and four Democrats sought re-election but lost in the primary or general election. One Republican sought election to finish the unexpired term but lost in the special election and one Republican sought election to a full term but lost in the general election.
Independent gain
One Democrat ran as an Independent in the general election.
| State | Senator | Replaced by |
|---|---|---|
| Virginia | Harry F. Byrd Jr. | Harry F. Byrd Jr. |
Post-election changes
| State | Senator | Replaced by |
|---|---|---|
| Georgia | Richard Russell Jr. | David H. Gambrell |
| Louisiana | Allen J. Ellender | Elaine Edwards |
| Vermont | Winston L. Prouty | Robert Stafford |
Change in composition
Before the elections
| D1 | D2 | D3 | D4 | D5 | D6 | D7 | D8 | D9 | D10 |
| D20 | D19 | D18 | D17 | D16 | D15 | D14 | D13 | D12 | D11 |
| D21 | D22 | D23 | D24 | D25 | D26 | D27 | D28 | D29 | D30 |
| D40 Minn. Retired |
D39 Mich. Ran |
D38 Mass. Ran |
D37 Md. Ran |
D36 Maine Ran |
D35 Ind. Ran |
D34 Fla. Retired |
D33 Conn. Ran |
D32 | D31 |
| D41 Miss. Ran |
D42 Mo. Ran |
D43 Mont. Ran |
D44 Nev. Ran |
D45 N.J. Ran |
D46 N.M. Ran |
D47 N.D. Ran |
D48 Ohio Ran |
D49 R.I. Ran |
D50 Tenn. Ran |
| Majority → | D51 Texas Ran | ||||||||
| R41 N.Y. Ran |
R42 Pa. Ran |
R43 Vt. Ran |
D51 Va. Ran |
D56 Wyo. Ran |
D55 Wis. Retired |
D54 W.Va. Ran |
D53 Wash. Ran |
D52 Utah Ran | |
| R40 Neb. Ran |
R39 Ill. (sp) Ran |
R38 Hawaii Ran |
R37 Del. Retired |
R36 Calif. Ran |
R35 Ariz. Ran |
R34 Alaska (sp) Ran |
R33 | R32 | R31 |
| R21 | R22 | R23 | R24 | R25 | R26 | R27 | R28 | R29 | R30 |
| R20 | R19 | R18 | R17 | R16 | R15 | R14 | R13 | R12 | R11 |
| R1 | R2 | R3 | R4 | R5 | R6 | R7 | R8 | R9 | R10 |
After the elections
| D1 | D2 | D3 | D4 | D5 | D6 | D7 | D8 | D9 | D10 |
| D20 | D19 | D18 | D17 | D16 | D15 | D14 | D13 | D12 | D11 |
| D21 | D22 | D23 | D24 | D25 | D26 | D27 | D28 | D29 | D30 |
| D40 Mo. Re-elected |
D39 Miss. Re-elected |
D38 Minn. Hold |
D37 Mich. Re-elected |
D36 Mass. Re-elected |
D35 Maine Re-elected |
D34 Ind. Re-elected |
D33 Fla. Hold |
D32 | D31 |
| D41 Mont. Re-elected |
D42 Nev. Re-elected |
D43 N.J. Re-elected |
D44 N.M. Re-elected |
D45 N.D. Re-elected |
D46 R.I. Re-elected |
D47 Texas Hold |
D48 Utah Re-elected |
D49 Wash. Re-elected |
D50 W.Va. Re-elected |
| Majority → | D51 Wis. Re-elected | ||||||||
| R41 Conn. Gain |
R42 Md. Gain |
R43 Ohio Gain |
R44 Tenn. Gain |
C1 N.Y. Gain[lower-alpha 5] |
I1 Va. Re-elected/Gain |
D54 Ill. (sp) Gain[lower-alpha 5] |
D53 Calif. Gain |
D52 Wyo. Re-elected | |
| R40 Vt. Re-elected |
R39 Pa. Re-elected |
R38 Neb. Re-elected |
R37 Hawaii Re-elected |
R36 Del. Hold |
R35 Ariz. Re-elected |
R34 Alaska (sp) Elected[lower-alpha 6] |
R33 | R32 | R31 |
| R21 | R22 | R23 | R24 | R25 | R26 | R27 | R28 | R29 | R30 |
| R20 | R19 | R18 | R17 | R16 | R15 | R14 | R13 | R12 | R11 |
| R1 | R2 | R3 | R4 | R5 | R6 | R7 | R8 | R9 | R10 |
| Key: |
|
|---|
Race summary
Special elections during the 91st Congress
In these special elections, the winner was seated during 1970 or before January 3, 1971; ordered by election date, then state.
| State | Incumbent | Results | Candidates | ||
|---|---|---|---|---|---|
| Senator | Party | Electoral history | |||
| Alaska (Class 2) |
Ted Stevens | Republican | 1968 (Appointed) | Interim appointee elected November 3, 1970. |
|
| Illinois (Class 3) |
Ralph Tyler Smith | Republican | 1969 (Appointed) | Interim appointee lost election. New senator elected November 3, 1970. Democratic gain. |
|
Elections leading to the next Congress
In these general elections, the winners were elected for the term beginning January 3, 1971; ordered by state.
All of the elections involved the Class 1 seats.
| State | Incumbent | Results | Candidates | ||
|---|---|---|---|---|---|
| Senator | Party | Electoral history | |||
| Arizona | Paul Fannin | Republican | 1964 | Incumbent re-elected. |
|
| California | George Murphy | Republican | 1964 1964 (Appointed) |
Incumbent lost re-election. New senator elected. Democratic gain Incumbent resigned January 1, 1971 to give successor preferential seniority. Winner appointed January 2, 1971. |
|
| Connecticut | Thomas J. Dodd | Democratic | 1958 1964 |
Incumbent lost renomination, then ran as an Independent candidate but lost re-election. New senator elected. Republican gain. |
|
| Delaware | John J. Williams | Republican | 1946 1952 1958 1964 |
Incumbent retired. New senator elected. Republican hold. Incumbent resigned December 31, 1970 to give successor preferential seniority. Winner appointed January 1, 1971. |
|
| Florida | Spessard Holland | Democratic | 1946 (Appointed) 1946 1952 1958 1964 |
Incumbent retired. New senator elected. Democratic hold. |
|
| Hawaii | Hiram Fong | Republican | 1959 1964 |
Incumbent re-elected. |
|
| Indiana | Vance Hartke | Democratic | 1958 1964 |
Incumbent re-elected. |
|
| Maine | Edmund Muskie | Democratic | 1958 1964 |
Incumbent re-elected. |
|
| Maryland | Joseph Tydings | Democratic | 1964 | Incumbent lost re-election. New senator elected. Republican gain. |
|
| Massachusetts | Ted Kennedy | Democratic | 1962 (special) 1964 |
Incumbent re-elected. |
|
| Michigan | Philip Hart | Democratic | 1958 1964 |
Incumbent re-elected. |
|
| Minnesota | Eugene McCarthy | DFL[4] | 1958 1964 |
Incumbent retired. New senator elected. DFL hold. |
|
| Mississippi | John C. Stennis | Democratic | 1947 (special) 1952 1958 1964 |
Incumbent re-elected. |
|
| Missouri | Stuart Symington | Democratic | 1952 1958 1964 |
Incumbent re-elected. |
Others
|
| Montana | Mike Mansfield | Democratic | 1952 1958 1964 |
Incumbent re-elected. |
|
| Nebraska | Roman Hruska | Republican | 1954 (special) 1958 1964 |
Incumbent re-elected. |
|
| Nevada | Howard Cannon | Democratic | 1958 1964 |
Incumbent re-elected. |
|
| New Jersey | Harrison A. Williams | Democratic | 1958 1964 |
Incumbent re-elected. |
|
| New Mexico | Joseph Montoya | Democratic | 1964 (special) 1964 |
Incumbent re-elected. |
|
| New York | Charles Goodell | Republican | 1968 (Appointed) | Interim appointee lost election. New senator elected. Conservative gain. |
|
| North Dakota | Quentin Burdick | Democratic-NPL | 1960 (special) 1964 |
Incumbent re-elected. |
|
| Ohio | Stephen M. Young | Democratic | 1958 1964 |
Incumbent retired. New senator elected. Republican gain. |
|
| Pennsylvania | Hugh Scott | Republican | 1958 1964 |
Incumbent re-elected. |
|
| Rhode Island | John Pastore | Democratic | 1950 (special) 1952 1958 1964 |
Incumbent re-elected. |
|
| Tennessee | Albert Gore Sr. | Democratic | 1952 1958 1964 |
Incumbent lost re-election. New senator elected. Republican gain. |
|
| Texas | Ralph Yarborough | Democratic | 1957 (special) 1958 1964 |
Incumbent lost renomination. New senator elected. Democratic hold. |
|
| Utah | Frank Moss | Democratic | 1958 1964 |
Incumbent re-elected. |
|
| Vermont | Winston L. Prouty | Republican | 1958 1964 |
Incumbent re-elected. |
|
| Virginia | Harry F. Byrd Jr. | Democratic | 1965 (Appointed) 1966 (special) |
Incumbent ran as an Independent and was re-elected. Independent gain. |
|
| Washington | Henry M. Jackson | Democratic | 1952 1958 1964 |
Incumbent re-elected. |
Others
|
| West Virginia | Robert Byrd | Democratic | 1958 1964 |
Incumbent re-elected. |
|
| Wisconsin | William Proxmire | Democratic | 1957 (special) 1958 1964 |
Incumbent re-elected. |
|
| Wyoming | Gale W. McGee | Democratic | 1958 1964 |
Incumbent re-elected. |
|
Closest races
Fourteen races had a margin of victory under 10%:
| State | Party of winner | Margin |
|---|---|---|
| Indiana | Democratic | 0.2% |
| New York | Conservative (flip) | 2.0% |
| Ohio | Republican (flip) | 2.2% |
| Maryland | Republican (flip) | 2.6% |
| Missouri | Democratic | 3.0% |
| Hawaii | Republican | 3.2% |
| Tennessee | Republican (flip) | 3.9% |
| Nebraska | Republican | 5.0% |
| New Mexico | Democratic | 5.7% |
| Pennsylvania | Republican | 6.0% |
| Texas | Democratic | 7.1% |
| Florida | Democratic | 7.8%[lower-alpha 7] |
| Connecticut | Republican (flip) | 7.9% |
| California | Democratic (flip) | 9.6% |
Alaska (special)
| |||||||||||||||||
| |||||||||||||||||
Republican Ted Stevens was appointed December 24, 1968 to finish the term of Democrat Bob Bartlett, who had died in office. The open primary was held August 25, 1970, in which Stevens received 40,411 votes (55.91%), Key received 29,459 votes (23.94%), State senator Joe Josephson received 12,730 votes (18.22%) and Fritz Singer (R) received 1,349 votes (1.93%).[5][6] In the November 3, 1970 special election to finish the term, he ran against the Democratic Speaker of the Alaska House of Representatives Wendell P. Kay. Stevens easily won with almost 60% of the vote.[7]
| Party | Candidate | Votes | % | |
|---|---|---|---|---|
| Republican | Ted Stevens (Incumbent) | 47,908 | 59.61 | |
| Democratic | Wendell P. Kay | 32,456 | 40.39 | |
| Majority | 14,452 | 18.22 | ||
| Turnout | 80,364 | |||
| Republican hold | ||||
Arizona
| |||||||||||||||||
 Results map. Counties won by Fannin Counties won by Grossman | |||||||||||||||||
| |||||||||||||||||
Incumbent Republican Paul Fannin decided to run for re-election to a second term, running unopposed in the Republican primary. Fannin defeated Democratic businessman Sam Grossman in the general election.
| Party | Candidate | Votes | % | |
|---|---|---|---|---|
| Democratic | Sam Grossman | 78,006 | 65.24 | |
| Democratic | John Kruglick, Doctor | 27,324 | 22.85 | |
| Democratic | H. L. Kelly | 14,238 | 11.91 | |
| Total votes | 119,568 | 100.00 | ||
| Party | Candidate | Votes | % | |
|---|---|---|---|---|
| Republican | Paul Fannin (Incumbent) | 228,284 | 55.98 | |
| Democratic | Sam Grossman | 179,512 | 44.02 | |
| Majority | 48,772 | 11.96 | ||
| Turnout | 407,796 | |||
| Republican hold | ||||
California
| |||||||||||||||||
 County results Tunney: 40–50% 50–60% 60–70% Murphy: 40–50% 50–60% | |||||||||||||||||
| |||||||||||||||||
| Party | Candidate | Votes | % | |
|---|---|---|---|---|
| Democratic | John V. Tunney | 3,496,558 | 53.86 | |
| Republican | George Murphy (Incumbent) | 2,877,617 | 44.32 | |
| Peace and Freedom | Robert Scheer | 61,251 | 0.94 | |
| American Independent | Charles C. Ripley | 56,731 | 0.87 | |
| Majority | 618,941 | 9.54 | ||
| Turnout | 6,492,157 | |||
| Democratic gain from Republican | ||||
Connecticut
| |||||||||||||||||||||
 County results | |||||||||||||||||||||
| |||||||||||||||||||||
Republican Lowell P. Weicker Jr. defeated Democrat Joseph Duffey and incumbent Thomas J. Dodd who ran this time as an independent. Dodd entered the race at the last minute and split the Democratic vote, allowing Weicker to win with only 42% of the vote.
| Party | Candidate | Votes | % | ||
|---|---|---|---|---|---|
| Republican | Lowell P. Weicker Jr. | 454,721 | 41.74 | ||
| Democratic | Joseph Duffey | 368,111 | 33.79 | ||
| Independent | Thomas J. Dodd (Incumbent) | 266,497 | 24.46 | ||
| Majority | 86,610 | 7.95 | |||
| Turnout | 1,089,329 | ||||
| Republican hold | |||||
Delaware
| |||||||||||||||||
 County Results Roth: 50-60% 60-70% | |||||||||||||||||
| |||||||||||||||||
Four-term Republican John J. Williams decided to retire, rather than run for re-election. Republican William Roth easily defeated Democrat Jacob Zimmerman by a margin of eighteen percentage points, and went on to serve thirty years in the Senate.
| Party | Candidate | Votes | % | |
|---|---|---|---|---|
| Republican | William Roth | 94,979 | 58.83 | |
| Democratic | Jacob W. Zimmerman | 64,740 | 40.10 | |
| American Independent | Donald G. Gies | 1,720 | 1.07 | |
| Majority | 30,239 | 18.73 | ||
| Turnout | 161,439 | |||
| Republican hold | ||||
Florida
| |||||||||||||||||
| |||||||||||||||||
 County results
Chiles: 50–60% 60–70% 70–80% 80–90% Cramer: 50–60% 60–70% | |||||||||||||||||
| |||||||||||||||||
Incumbent Democrat Spessard Holland retired instead of seeking a fifth term. During the Democratic primary, former Governor C. Farris Bryant and State senator Lawton Chiles advanced to a run-off, having received more votes than Speaker of the Florida House of Representatives Frederick H. Schultz, attorney Alcee Hastings, and State Representative Joel T. Daves, III. Chiles soundly defeated Bryant in the run-off election, scoring a major upset due to his comparatively small name recognition prior to the election. To acquire name recognition and media coverage, Chiles walked about 1,003 miles (1,614 km) across the state of Florida and was given the nickname "Walkin' Lawton".
The Republican primary exposed an in-party feud between Governor Claude R. Kirk Jr. and U.S. Representative William C. Cramer. In the election, Cramer handily defeated G. Harrold Carswell and body shop owner George Balmer; the former was a Fifth Circuit Court of Appeals judge favored by Kirk and had been rejected as a Supreme Court of the United States nominee a few months prior to the primary. Chiles won the election by a relatively small margin of 7.8%, receiving 902,438 votes against Cramer's 772,817 votes.
Incumbent Spessard Holland, who served in the Senate since 1946, decided to retire rather than seek a fifth term.[11] Although the Democratic Party had dominated state elections since the Reconstruction Era, Claude R. Kirk Jr. and Edward Gurney, both Republicans, were elected senator and Governor in 1966 and 1968, respectively.[12]
| Party | Candidate | Votes | % | |
|---|---|---|---|---|
| Democratic | C. Farris Bryant | 240,222 | 32.90 | |
| Democratic | Lawton Chiles | 188,300 | 25.79 | |
| Democratic | Frederick H. Schultz | 175,745 | 24.07 | |
| Democratic | Alcee Hastings | 91,948 | 12.59 | |
| Democratic | Joel Daves | 33,939 | 4.65 | |
| Total votes | 730,154 | 100.00 | ||
| Party | Candidate | Votes | % | |
|---|---|---|---|---|
| Democratic | Lawton Chiles | 474,420 | 65.74 | |
| Democratic | Farris Bryant | 247,211 | 34.26 | |
| Total votes | 721,631 | 100.00 | ||
| Party | Candidate | Votes | % | |
|---|---|---|---|---|
| Republican | William C. Cramer | 220,553 | 62.52 | |
| Republican | G. Harrold Carswell | 121,281 | 34.38 | |
| Republican | George Balmer, body shop owner | 10,947 | 3.10 | |
| Total votes | 352,781 | 100.00 | ||
| Party | Candidate | Votes | % | ±% | |
|---|---|---|---|---|---|
| Democratic | Lawton Chiles | 902,438 | 53.87 | -10.09% | |
| Republican | William C. Cramer | 772,817 | 46.13 | +10.09% | |
| Majority | 129,621 | 7.74 | -20.17% | ||
| Turnout | 1,675,255 | [?] | [?] | ||
| Democratic hold | Swing | ||||
Hawaii
| |||||||||||||||||
 Fong: 50–60% | |||||||||||||||||
| |||||||||||||||||
| Party | Candidate | Votes | % | |
|---|---|---|---|---|
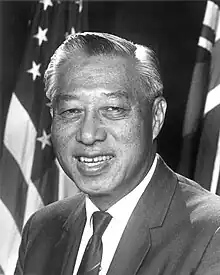
| Republican | Hiram Fong (Incumbent) | 124,163 | 51.57 | |
| Democratic | Cecil Heftel | 116,597 | 48.43 | |
| Majority | 7,566 | 3.14 | ||
| Turnout | 240,760 | |||
| Republican hold | ||||
Illinois (special)
| Turnout | 67.43% | ||||||||||||||||
|---|---|---|---|---|---|---|---|---|---|---|---|---|---|---|---|---|---|
| |||||||||||||||||
 County Results Stevenson: 50–60% 60–70% Smith: 50–60% 60–70% | |||||||||||||||||
| |||||||||||||||||
A special election was held to fill the remainder of the term of Republican Everett Dirksen, who had died in office. Republican Ralph Tyler Smith had been appointed to fill the seat after Dirksen's death, and he lost the special election to Democrat Adlai Stevenson III.
| Party | Candidate | Votes | % | |
|---|---|---|---|---|
| Democratic | Adlai Stevenson III | 2,065,054 | 57.37 | |
| Republican | Ralph Tyler Smith (Incumbent) | 1,519,718 | 42.22 | |
| Socialist Workers | Lynn Henderson | 8,859 | 0.25 | |
| Socialist Labor | Louis Fisher | 5,564 | 0.15 | |
| None | Scattering | 77 | 0.00 | |
| Majority | 545,336 | 15.15 | ||
| Turnout | 3,599,272 | |||
| Democratic gain from Republican | ||||
Indiana
| |||||||||||||||||
 County Results Hartke: 50–60% 60–70% Roudebush: 50–60% 60–70% 70–80% | |||||||||||||||||
| |||||||||||||||||
| Party | Candidate | Votes | % | |
|---|---|---|---|---|
| Democratic | Vance Hartke (Incumbent) | 870,990 | 50.12 | |
| Republican | Richard L. Roudebush | 866,707 | 49.88 | |
| Majority | 4,283 | 0.24 | ||
| Turnout | 1,737,697 | |||
| Democratic hold | ||||
Maine
| |||||||||||||||||
 County results Muskie: 50–60% 60–70% 70–80% | |||||||||||||||||
| |||||||||||||||||
| Party | Candidate | Votes | % | |
|---|---|---|---|---|
| Democratic | Edmund S. Muskie (Incumbent) | 199,954 | 61.74 | |
| Republican | Neil S. Bishop | 123,906 | 38.26 | |
| Majority | 76,048 | 23.48 | ||
| Turnout | 323,860 | |||
| Democratic hold | ||||
Maryland
| |||||||||||||||||
 County results Beall: 50–60% 60–70% 70–80% Tydings: 50–60% 60–70% | |||||||||||||||||
| |||||||||||||||||
| Party | Candidate | Votes | % | |
|---|---|---|---|---|
| Republican | John Glenn Beall Jr. | 484,960 | 50.71 | |
| Democratic | Joseph D. Tydings (Incumbent) | 460,422 | 48.14 | |
| American Independent | Harvey Wilder | 10,988 | 1.15 | |
| Majority | 24,538 | 2.57 | ||
| Turnout | 956,370 | |||
| Republican gain from Democratic | ||||
Massachusetts
| |||||||||||||||||
 Results by town. Red indicates towns won by Spaulding. Blue indicates towns won by Kennedy. | |||||||||||||||||
| |||||||||||||||||
Incumbent Democrat Ted Kennedy defeated his challengers. This was Kennedy's first election run since the 1969 Chappaquiddick incident. Kennedy won 62.2%, down from 74.3% that he won in the previous election in 1964; this decrease was due to numerous factors including Chappaquiddick and a far more favorable environment for the Republicans than the Democratic landslide year of 1964.
The Republican nominee was Josiah Spaulding, a businessman and Republican leader in Massachusetts. He led a group of delegates at the 1968 Republican National Convention who unsuccessfully sought to nominate Nelson A. Rockefeller over Richard Nixon.[15]
Other candidates were Lawrence Gilfedder (Socialist Labor) and Mark R. Shaw (Prohibition), a former Prohibition Party candidate for U.S. senator from Massachusetts in 1946, 1952, 1958, 1969, 1962, and 1966. He was the party's candidate for governor of Massachusetts in 1948 and 1956. In 1964, he was the Prohibition Party's candidate for vice-president of the United States.[16]

| Party | Candidate | Votes | % | ±% | |
|---|---|---|---|---|---|
| Democratic | Edward M. Kennedy (Incumbent) | 1,202,856 | 62.16 | -12.1 | |
| Republican | Josiah Spaulding | 715,978 | 37.00 | +11.58 | |
| Socialist Labor | Lawrence Gilfedder | 10,378 | 0.54 | +0.33 | |
| Prohibition | Mark R. Shaw | 5,944 | 0.31 | +0.19 | |
| None | Scattering | 451 | 0.02 | +0.02 | |
| Majority | 486,878 | 25.16 | |||
| Turnout | 1,935,607 | ||||
| Democratic hold | Swing | ||||
Michigan
.jpg.webp)
| Party | Candidate | Votes | % | |
|---|---|---|---|---|
| Democratic | Philip Hart (Incumbent) | 1,744,672 | 66.83 | |
| Republican | Lenore Romney | 858,438 | 32.88 | |
| Socialist Workers | Paul Ludieu | 3,861 | 0.15 | |
| Socialist Labor | James Sim | 3,254 | 0.12 | |
| None | Scattering | 538 | 0.02 | |
| Majority | 886,234 | 33.95 | ||
| Turnout | 2,610,763 | |||
| Democratic hold | ||||
Minnesota
| |||||||||||||||||
| |||||||||||||||||
 County results Humphrey: 40-50% 50–60% 60–70% 70–80% MacGregor: 50-60% | |||||||||||||||||
| |||||||||||||||||
Incumbent Democrat Eugene McCarthy retired instead of seeking a third term. Former Democratic U.S. senator, Vice President and 1968 presidential nominee Hubert Humphrey defeated Republican U.S. Representative Clark MacGregor.
| Party | Candidate | Votes | % | |
|---|---|---|---|---|
| Democratic (DFL) | Hubert H. Humphrey | 338,705 | 79.25 | |
| Democratic (DFL) | Earl D. Craig | 88,709 | 20.76 | |
| Party | Candidate | Votes | % | |
|---|---|---|---|---|
| Republican | Clark MacGregor | 220,353 | 93.31 | |
| Republican | John D. Baucom | 15,797 | 6.69 | |
| Party | Candidate | Votes | % | |
|---|---|---|---|---|
| Democratic (DFL) | Hubert H. Humphrey | 788,256 | 57.75 | |
| Republican | Clark MacGregor | 568,025 | 41.62 | |
| Socialist Workers | Nancy Strebe | 6,122 | 0.45 | |
| Industrial Government | William Braatz | 2,484 | 0.18 | |
| Majority | 220,231 | 16.13 | ||
| Turnout | 1,364,887 | |||
| Democratic (DFL) hold | ||||
Mississippi
| |||||||||||||||||
| |||||||||||||||||
 County results Stennis: 50–60% 60–70% 70–80% 80–90% >90% | |||||||||||||||||
| |||||||||||||||||
| Party | Candidate | Votes | % | |
|---|---|---|---|---|
| Democratic | John C. Stennis (Incumbent) | 286,622 | 88.40 | |
| Independent | William Richard Thompson | 37,593 | 11.60 | |
| Majority | 249,029 | 76.80 | ||
| Turnout | 324,215 | |||
| Democratic hold | ||||
Missouri
| |||||||||||||||||
| |||||||||||||||||
 County Results Symington: 40–50% 50–60% 60–70% 70–80% Danforth: 50-60% 60-70% 70-80% | |||||||||||||||||
| |||||||||||||||||
| Party | Candidate | Votes | % | |
|---|---|---|---|---|
| Democratic | Stuart Symington (Incumbent) | 654,831 | 51.03 | |
| Republican | John C. Danforth | 617,903 | 48.15 | |
| American Independent | Gene Chapman | 10,065 | 0.78 | |
| Independent | E. J. DiGirolamo | 513 | 0.04 | |
| Majority | 36,928 | 2.88 | ||
| Turnout | 1,283,312 | |||
| Democratic hold | ||||
Montana
| |||||||||||||||||
| |||||||||||||||||
 County results Mansfield: 50–60% 60–70% 70–80% Wallace: 50-60% 60-70% | |||||||||||||||||
| |||||||||||||||||
Democratic incumbent Mike Mansfield, the Senate Majority Leader who was first elected to the Senate in 1952, and was re-elected in 1958 and 1964, ran for re-election. Mansfield won the primary against several opponents, and advanced to the general election, where he was opposed by Harold E. Wallace, a sporting goods salesman and the Republican nominee. While his margin of victory decreased slightly from 1964, Mansfield still managed to defeat Wallace overwhelmingly, winning his fourth and (what would turn out to be his) final term in the Senate.
| Party | Candidate | Votes | % | |
|---|---|---|---|---|
| Democratic | Mike Mansfield (Incumbent) | 68,146 | 77.17 | |
| Democratic | Tom McDonald | 10,773 | 12.20 | |
| Democratic | John W. Lawlor | 19,384 | 10.63 | |
| Total votes | 88,303 | 100.00 | ||
| Party | Candidate | Votes | % | |
|---|---|---|---|---|
| Republican | Harold E. Wallace | 45,549 | 100.00 | |
| Total votes | 45,549 | 100.00 | ||
| Party | Candidate | Votes | % | ±% | |
|---|---|---|---|---|---|
| Democratic | Mike Mansfield (Incumbent) | 150,060 | 60.54 | -3.97% | |
| Republican | Harold E. Wallace | 97,809 | 39.46 | +3.97% | |
| Majority | 52,251 | 21.08 | -7.95% | ||
| Turnout | 247,869 | ||||
| Democratic hold | Swing | ||||
Nebraska
| |||||||||||||||||
| |||||||||||||||||
 County results Hruska: 50–60% 60–70% 70–80% Morrison: 50–60% 60–70% | |||||||||||||||||
| |||||||||||||||||
The incumbent Republican Roman Hruska was re-elected.
| Party | Candidate | Votes | % | |
|---|---|---|---|---|
| Republican | Roman Hruska (Incumbent) | 240,894 | 52.49 | |
| Democratic | Frank B. Morrison | 217,681 | 47.43 | |
| None | Scattering | 391 | 0.09 | |
| Majority | 23,213 | 5.06 | ||
| Turnout | 458,966 | |||
| Republican hold | ||||
Nevada
| |||||||||||||||||
| |||||||||||||||||
Democrat Howard Cannon, the incumbent since 1959, won re-election to a third term over William Raggio, the Washoe County District Attorney.
In the Senate, Cannon was known as a moderate in the Democratic Party. He served as chairman of several committees, including the rules committee and the inaugural arrangements committee. Cannon was nearly defeated for re-election in 1964 by Republican Lieutenant Governor Paul Laxalt in one of the closest election in history. However, he became more popular over the next few years and defeated D.A. William Raggio, whose 1970 senate campaign began his long political career. Raggio ran for the Nevada Senate in 1972 and won. He then served there for decades to come.
| Party | Candidate | Votes | % | ±% | |
|---|---|---|---|---|---|
| Democratic | Howard Cannon (Incumbent) | 85,187 | 57.65 | +7.63% | |
| Republican | William Raggio | 60,838 | 41.17 | -8.81% | |
| American Independent | Harold G. DeSellem | 1,743 | 1.18 | ||
| Majority | 24,349 | 16.48 | +16.44% | ||
| Turnout | 147,768 | ||||
| Democratic hold | Swing | ||||
New Jersey
| |||||||||||||||||
 County Results Williams: 40–50% 50–60% 60–70% Gross: 40–50% 50-60% | |||||||||||||||||
| |||||||||||||||||
| Party | Candidate | Votes | % | |
|---|---|---|---|---|
| Democratic | Harrison A. Williams (Incumbent) | 1,157,074 | 56.17 | |
| Republican | Nelson G. Gross | 903,026 | 43.83 | |
| Majority | 254,048 | 12.34 | ||
| Turnout | 2,060,100 | |||
| Democratic hold | ||||
New Mexico
| |||||||||||||||||
 County results | |||||||||||||||||
| |||||||||||||||||
Incumbent Democrat Joseph Montoya successfully ran for re-election to a second term, defeating Republican Anderson Carter.
| Party | Candidate | Votes | % | |
|---|---|---|---|---|
| Democratic | Joseph Montoya, Incumbent | 85,285 | 73.10 | |
| Democratic | Richard B. Edwards | 31,381 | 26.90 | |
| Majority | 53,904 | 46.20 | ||
| Total votes | 116,666 | 100.00 | ||
| Party | Candidate | Votes | % | |
|---|---|---|---|---|
| Republican | Anderson Carter | 32,122 | 57.76 | |
| Republican | David Cargo, Governor of New Mexico | 16,951 | 32.28 | |
| Republican | Harold G. Thompson | 5,544 | 9.97 | |
| Majority | 14,171 | 25.48 | ||
| Total votes | 55,617 | 100.00 | ||
| Party | Candidate | Votes | % | |
|---|---|---|---|---|
| Democratic | Joseph Montoya, Incumbent | 151,486 | 52.26 | |
| Republican | Anderson Carter | 135,004 | 46.57 | |
| People's Constitutional | William Higgs | 3,382 | 1.17 | |
| Majority | 16,482 | 5.69 | ||
| Total votes | 289,872 | 100.00 | ||
| Democratic hold | ||||
New York
| |||||||||||||||||||||
 County results | |||||||||||||||||||||
| |||||||||||||||||||||
Incumbent Republican Charles Goodell, who was recently appointed to the seat by Governor Nelson Rockefeller after senator Bobby Kennedy (D) was assassinated, ran for a full term, but was defeated by the Conservative Party of New York nominee James L. Buckley. Other candidates included: Richard Ottinger, U.S. Congressman (1965–1971, 1975–1985), Kevin P. McGovern, Paul O'Dwyer, Former New York City Council Member from Manhattan, Ted Sorensen, Former Advisor and Speechwriter to President John F. Kennedy, Richard D. McCarthy, U.S. Congressman (1965-1971).
| Party | Candidate | Votes | % | |
|---|---|---|---|---|
| Conservative | James L. Buckley | 37,940 | 91.38 | |
| Conservative | Kevin P. McGovern | 3,580 | 8.62 | |
| Total votes | 41,520 | 100.00 | ||
| Party | Candidate | Votes | % | |
|---|---|---|---|---|
| Democratic | Richard Ottinger | 366,789 | 39.61 | |
| Democratic | Paul O'Dwyer | 302,438 | 32.66 | |
| Democratic | Ted Sorensen | 154,434 | 16.68 | |
| Democratic | Richard D. McCarthy | 102,224 | 11.04 | |
| Total votes | 925,885 | 100.00 | ||
| Party | Candidate | Votes | % | |
|---|---|---|---|---|
| Republican | Charles Goodell (Incumbent) | 311 | 86.39 | |
| Abstaining | 49 | 13.61 | ||
| Total votes | 360 | 100.00 | ||
| Party | Candidate | Votes | % | |
|---|---|---|---|---|
| Liberal | Charles Goodell (Incumbent) | 201 | 67.00 | |
| Liberal | Paul O'Dwyer | 48 | 16.00 | |
| Liberal | Richard D. McCarthy | 33 | 11.00 | |
| Liberal | Richard Ottinger | 12 | 4.00 | |
| Liberal | Ted Sorensen | 6 | 2.00 | |
| Total votes | 300 | 100.00 | ||
| Party | Candidate | Votes | % | |
|---|---|---|---|---|
| Conservative | James L. Buckley | 2,288,190 | 38.95 | |
| Democratic | Richard Lawrence Ottinger | 2,171,232 | 36.96 | |
| Republican | Charles Goodell (Incumbent) | 1,178,679 | ||
| Liberal | Charles Goodell (Incumbent) | 225,793 | ||
| Republican + Liberal Party | Charles Goodell (Incumbent) | 1,404,472 | 23.91 | |
| Communist | Arnold Johnson | 4,097 | 0.07 | |
| Socialist Workers | Kipp Dawson | 3,549 | 0.06 | |
| Socialist Labor | John Emanuel | 3,204 | 0.06 | |
| Majority | 116,958 | 1.99 | ||
| Turnout | 5,904,744 | |||
| Conservative gain from Republican | ||||
North Dakota
| |||||||||||||||||
 U.S. Senate election results map. Blue denotes counties won by Burdick. Red denotes those won by Kleppe.
| |||||||||||||||||
| |||||||||||||||||
Incumbent Democratic-NPL Party Senator Quentin N. Burdick was re-elected to his third term, defeating Republican candidate Thomas S. Kleppe, who later became the United States Secretary of the Interior.[1]
Only Burdick filed as a Dem-NPLer, and the endorsed Republican candidate was Thomas S. Kleppe, who was finishing his second and final term as a Representative for North Dakota's second congressional district. Burdick and Kleppe won the primary elections for their respective parties.
One independent candidate, Russell Kleppe, also filed before the deadline.
| Party | Candidate | Votes | % | |
|---|---|---|---|---|
| Democratic–NPL | Quentin Burdick (Incumbent) | 134,519 | 61.27 | |
| Republican | Thomas S. Kleppe | 82,996 | 37.80 | |
| Independent | Russell Kleppe | 2,045 | 0.93 | |
| Majority | 51,523 | 23.47 | ||
| Turnout | 219,560 | |||
| Democratic hold | ||||
Ohio

| Party | Candidate | Votes | % | |
|---|---|---|---|---|
| Republican | Robert Taft Jr. | 1,565,682 | 49.68 | |
| Democratic | Howard M. Metzenbaum | 1,495,262 | 47.45 | |
| American Independent | Richard B. Kay | 61,261 | 1.94 | |
| Socialist Labor | John O'Neill | 29,069 | 0.92 | |
| Majority | 70,420 | 2.23 | ||
| Turnout | 3,151,274 | |||
| Republican gain from Democratic | ||||
Pennsylvania
| |||||||||||||||||
 County results | |||||||||||||||||
| |||||||||||||||||
Incumbent Republican Hugh Scott won re-election, defeating Democratic nominee State senator William Sesler.
| Party | Candidate | Votes | % | ±% | |
|---|---|---|---|---|---|
| Republican | Hugh Scott (Incumbent) | 1,874,106 | 51.43 | +0.84% | |
| Democratic | William Sesler | 1,653,774 | 45.38 | -3.74% | |
| Constitution | Frank W. Gaydosh | 85,813 | 2.36 | +2.36% | |
| American Independent | W. Henry McFarland | 18,275 | 0.50 | +0.50% | |
| Socialist Labor | Herman A. Johnson | 4,375 | 0.12 | -0.02% | |
| Socialist Workers | Robin Maisel | 3,970 | 0.11 | -0.04% | |
| Consumer | William R. Mimms | 3,932 | 0.11 | +0.11% | |
| N/A | Other | 60 | 0.00 | N/A | |
| Majority | 220,332 | 6.05 | |||
| Turnout | 3,644,305 | ||||
| Republican hold | Swing | ||||
Rhode Island
| |||||||||||||||||
 County results | |||||||||||||||||
| |||||||||||||||||
| Party | Candidate | Votes | % | |
|---|---|---|---|---|
| Democratic | John O. Pastore (Incumbent) | 230,469 | 67.54 | |
| Republican | John McLaughlin | 107,351 | 31.46 | |
| Peace and Freedom | David N. Fenton | 2,406 | 0.71 | |
| Socialist Workers | Daniel B. Fein | 996 | 0.29 | |
| Majority | 123,118 | 36.08 | ||
| Turnout | 341,222 | |||
| Democratic hold | ||||
Tennessee
| |||||||||||||||||
| |||||||||||||||||
Republican Bill Brock defeated incumbent senator Albert Gore Sr.
| Party | Candidate | Votes | % | |
|---|---|---|---|---|
| Republican | Bill Brock | 562,645 | 51.29 | |
| Democratic | Albert Gore Sr. (Incumbent) | 519,858 | 47.39 | |
| American Independent | Cecil Pitard | 8,691 | 0.79 | |
| Independent | Dan R. East | 5,845 | 0.53 | |
| None | Scattering | 2 | 0.00 | |
| Majority | 42,787 | 3.90 | ||
| Turnout | 1,097,041 | |||
| Republican hold | ||||
Texas
| |||||||||||||||||
 County results | |||||||||||||||||
| |||||||||||||||||
Incumbent Democrat Ralph Yarborough was defeated by former Representative Lloyd Bentsen in the Democratic primary. Bentsen then defeated Representative George H. W. Bush in the general election. When Bush was running for president in 1988, his Democratic opponent, Massachusetts Governor Michael Dukakis, selected Bentsen as his vice presidential running mate.
| Party | Candidate | Votes | % | |
|---|---|---|---|---|
| Democratic | Lloyd Bentsen | 1,226,568 | 53.34 | |
| Republican | George H. W. Bush | 1,071,234 | 46.58 | |
| None | Scattering | 1,808 | 0.08 | |
| Majority | 155,334 | 6.76 | ||
| Turnout | 2,299,610 | |||
| Democratic hold | ||||
Utah

| Party | Candidate | Votes | % | |
|---|---|---|---|---|
| Democratic | Frank Moss (Incumbent) | 210,207 | 56.16 | |
| Republican | Laurence J. Burton | 159,004 | 42.48 | |
| American Independent | Clyde B. Freeman | 5,092 | 1.36 | |
| Majority | 51,203 | 13.68 | ||
| Turnout | 374,303 | |||
| Democratic hold | ||||
Vermont
| |||||||||||||||||
 County results Prouty: 50–60% 60–70% 70–80% | |||||||||||||||||
| |||||||||||||||||
| Party | Candidate | Votes | % | |
|---|---|---|---|---|
| Republican | Winston L. Prouty (Incumbent) | 91,198 | 58.88 | |
| Democratic | Philip H. Hoff | 62,271 | 40.20 | |
| Liberty Union | William H. Meyer | 1,416 | 0.91 | |
| None | Scattering | 14 | 0.01 | |
| Majority | 28,927 | 18.68 | ||
| Turnout | 154,899 | |||
| Republican hold | ||||
Virginia
| |||||||||||||||||||||||||||||||||||||
 U.S. Senate election results map. Gray denotes counties/districts won by Byrd. Blue denotes those won by Rawlings. Red denotes those won by Garland. | |||||||||||||||||||||||||||||||||||||
| |||||||||||||||||||||||||||||||||||||
Incumbent Harry F. Byrd Jr. was re-elected to his first full term after winning a race 4 years earlier to finish the remainder of his father's term. He beat George C. Rawlings Jr. (D), a former member of the Virginia House of Delegates, and Ray L. Garland (R), a member of Virginia House of Delegates.
| Party | Candidate | Votes | % | ±% | ||
|---|---|---|---|---|---|---|
| Independent | Harry F. Byrd Jr. (Incumbent) | 506,237 | 53.54 | +53.54% | ||
| Democratic | George Rawlings | 294,582 | 31.15 | -22.15% | ||
| Republican | Ray L. Garland | 144,765 | 15.31 | -22.07% | ||
| Write-ins | 30 | <0.01 | -0.02% | |||
| Majority | 211,655 | 22.38 | +6.46% | |||
| Turnout | 945,614 | |||||
| Independent gain from Democratic | ||||||
Washington
| |||||||||||||||||
| |||||||||||||||||
| Party | Candidate | Votes | % | |
|---|---|---|---|---|
| Democratic | Henry M. Jackson (Incumbent) | 879,385 | 82.43 | |
| Republican | Charles W. Elicker | 170,790 | 16.01 | |
| Socialist Workers | Bill Massey | 9,255 | 0.87 | |
| Buffalo | Edison S. 'Pinky' Fisk | 7,377 | 0.69 | |
| Majority | 708,595 | 66.42 | ||
| Turnout | 1,066,807 | |||
| Democratic hold | ||||
West Virginia
| Party | Candidate | Votes | % | |
|---|---|---|---|---|
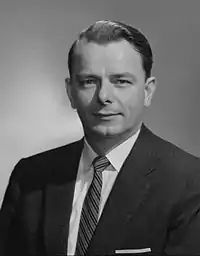
| Democratic | Robert C. Byrd (Incumbent) | 345,965 | 77.64 | |
| Republican | Elmer H. Dodson | 99,658 | 22.36 | |
| Majority | 246,307 | 54.28 | ||
| Turnout | 445,623 | |||
| Democratic hold | ||||
Wisconsin

| Party | Candidate | Votes | % | |
|---|---|---|---|---|
| Democratic | William Proxmire (Incumbent) | 948,445 | 70.83 | |
| Republican | John E. Erickson | 381,297 | 28.48 | |
| American Independent | Edmond E. Hou-Seye | 6,137 | 0.46 | |
| Independent | Elizabeth (Betty) Boardman | 2,022 | 0.15 | |
| Socialist Workers | Martha M. Quinn | 580 | 0.04 | |
| Socialist Labor | Adolf Wiggert | 428 | 0.03 | |
| None | Scattering | 58 | 0.00 | |
| Majority | 567,148 | 42.35 | ||
| Turnout | 1,338,967 | |||
| Democratic hold | ||||
Wyoming
| Party | Candidate | Votes | % | |
|---|---|---|---|---|
| Democratic | Gale W. McGee (Incumbent) | 67,207 | 55.78 | |
| Republican | John S. Wold | 53,279 | 44.22 | |
| Majority | 13,928 | 11.56 | ||
| Turnout | 120,486 | |||
| Democratic hold | ||||
See also
Notes
- 1 2 The Liberal Party in New York nominated Charles Goodell, a Republican, but the Clerk of the U.S. House of Representatives did not tabulate their votes, totaling 225,793, into the national Republican total.[1]
- ↑ In Texas, Ralph Yarborough lost renomination for another term, Lloyd Bentsen became the party's new nominee.
- 1 2 Includes three interim appointees who ran for election.
- ↑ Includes the interim appointee who won election to finish the term.
- 1 2 Appointee defeated
- ↑ Appointee elected
- ↑ Florida was the "tipping-point state".
References
- 1 2 3 4 5 6 7 8 9 10 11 12 13 14 15 16 17 18 19 20 21 22 23 24 25 26 27 28 29 30 31 32 33 34 35 36 Clerk of the United States House of Representatives (1971-05-01). "STATISTICS OF THE CONGRESSIONAL ELECTION OF NOVEMBER 3, 1970" (PDF). United States House of Representatives. p. 1, 39. Retrieved 22 November 2020.
- ↑ Harry F. Byrd, Jr. (VA), was an Independent who caucused with the Democrats. In some circles, he is called an "Independent Democrat", but his actual registration was listed as "Independent". See, e. g., United States Congress. "Harry Flood Byrd, Jr. (id: B001209)". Biographical Directory of the United States Congress.
- ↑ Kane, Paul (13 October 2018). "Stark political divide points to a split decision in midterm elections". The Washington Post. Retrieved 1 June 2020.
- ↑ The Minnesota Democratic–Farmer–Labor Party is affiliated nationally with the Democratic Party (United States).
- ↑ "AK US Senate - Special Open Primary". Retrieved June 23, 2018 – via OurCampaigns.com.
- ↑ "Josephson in Senate seat race". Fairbanks Daily News-Miner. Fairbanks, Alaska. August 17, 1970. p. 19. Retrieved 4 October 2021.
- ↑ "AK US Senate - Special". Retrieved June 23, 2018 – via Our Campaigns.
- ↑ "AZ US Senate - D Primary Race - September 8, 1970". Our Campaigns. Retrieved December 19, 2017.
- ↑ "AZ US Senate Race - November 3, 1970". Our Campaigns. Retrieved December 19, 2017.
- ↑ Our Campaigns - CT US Senate Race - November 3, 1970
- ↑ "Spessard Lindsey Holland". Tallahassee, Florida: Florida Department of State. Retrieved October 6, 2016.
- ↑ "Cramer v. Kirk," p. 403
- 1 2 3 "Tabulation of Official Votes, Florida Primary Election, Democratic and Republican, September 8, 1970 and September 29, 1970" (PDF). Florida Secretary of State. Retrieved March 13, 2015.
- ↑ "Our Campaigns - IN US Senate Race - Nov 03, 1970". www.ourcampaigns.com. Retrieved 2020-09-11.
- ↑ Josiah Spaulding at ourcampaigns.com
- ↑ Mark R. Shaw at ourcampaigns.com
- ↑ Massachusetts race details at ourcampaigns.com
- ↑ "MN US Senate- D Primary Race - September 15, 1970". Our Campaigns. Retrieved December 19, 2017.
- ↑ "MN US Senate- R Primary Race - September 15, 1970". Our Campaigns. Retrieved December 19, 2017.
- ↑ "Minnesota Legislative Manual - General Election Returns, November 3, 1970" (PDF). Minnesota Legislature. 1971–1972.
- ↑ "MN US Senate Race - November 3, 1970". Our Campaigns. Retrieved December 19, 2017.
- 1 2 "Report of the Official Canvass of the Vote Cast at the Primary Election Held in the State of Montana, June 2, 1970". Montana Secretary of State. Retrieved July 4, 2014.
- ↑ "NM US Senate - D Primary". OurCampaigns. Retrieved March 16, 2014.
- ↑ "NM US Senate - R Primary". OurCampaigns. Retrieved March 16, 2014.
- ↑ "NM US Senate". OurCampaigns. Retrieved March 16, 2014.
- 1 2 "NY US Senate - C Convention Race - April 7, 1970". Our Campaigns. Retrieved December 19, 2017.
- ↑ "NY US Senate - D Primary Race - June 23, 1970". Our Campaigns. Retrieved December 19, 2017.
- ↑ "NY US Senate - L Convention Race - May 11, 1970". Our Campaigns. Retrieved December 19, 2017.
- ↑ "NY US Senate Race - November 3, 1970". Our Campaigns. Retrieved December 19, 2017.
.png.webp)
.jpg.webp)



.jpg.webp)
.jpg.webp)
.jpg.webp)


.jpg.webp)

.jpg.webp)





.jpg.webp)
.jpg.webp)





.jpg.webp)


