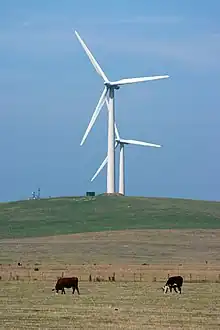
| Woolnorth Wind Farm | |
|---|---|
 | |
| Country |
|
| Location | Woolnorth, Tasmania |
| Coordinates | 40°41′06″S 144°43′01″E / 40.685°S 144.717°E |
| Commission date | 2002, 2004, 2007 |
| Owner(s) | Hydro Tasmania and Guohua Energy Investment Co. Ltd |
| Wind farm | |
| Hub height | 60 metres (197 ft) Vestas V66 80 metres (262 ft) Vestas V90 |
| Rotor diameter | 66 metres (217 ft) 90 metres (295 ft) |
| Power generation | |
| Units operational | 37 × 1.75 MW 25 × 3 MW |
| Make and model | Vestas V66 1.75 MW Vestas V90 3 MW |
| Nameplate capacity | 140 MW (190,000 hp) |
| Capacity factor | 39.68% (average 2011-2021) |
| Annual net output | 486.6 GWh (average 2011-2021) |
Woolnorth Wind Farm is a wind power complex, comprising two wind farms — Bluff Point and Studland Bay. They are located at the Woolnorth property at Woolnorth (which includes the location known as Cape Grim), in the far north-west of Tasmania, Australia. Both wind farms are operated by Woolnorth Wind Farm Holdings, a joint venture between Hydro Tasmania (who own a 25% share) and Shenhua Group (75% share).[1]
Farms
Bluff Point Wind Farm was constructed in two stages. The first consisted of six 1.75 MW Vestas V66 turbines and was commissioned in 2002. Stage two, commissioned in 2004, expanded the wind farm with a further 31 of the same turbines, for a total generating capacity of 65 MW.[2]
Studland Bay Wind Farm was commissioned in 2007 and consists of 25 Vestas V90 turbines, each with a capacity of 3 MW, for a total capacity of 75 MW.[2][3]
Tours to the wind farms are available and operated by a private commercial entity.
Operations
The generation table uses eljmkt nemlog to obtain generation values for each month. Records date back to 2011.
| Year | Total | Jan | Feb | Mar | Apr | May | Jun | Jul | Aug | Sep | Oct | Nov | Dec |
|---|---|---|---|---|---|---|---|---|---|---|---|---|---|
| 2011 | 469,716 | 39,658 | 35,858 | 42,696 | 31,365 | 30,879 | 46,484 | 46,893 | 30,734 | 46,957 | 39,985 | 39,969 | 38,238 |
| 2012 | 467,622 | 49,830 | 28,135 | 43,462 | 19,446 | 40,616 | 40,214 | 30,236 | 46,554 | 47,482 | 36,285 | 37,515 | 47,847 |
| 2013 | 536,388 | 35,686 | 40,057 | 46,856 | 37,311 | 35,635 | 38,169 | 43,667 | 62,645 | 50,599 | 57,331 | 37,831 | 50,601 |
| 2014 | 463,337 | 48,550 | 39,743 | 33,422 | 31,214 | 35,523 | 36,174 | 42,433 | 32,790 | 38,382 | 48,292 | 46,512 | 30,302 |
| 2015 | 483,614 | 44,238 | 41,695 | 38,120 | 28,442 | 48,737 | 35,140 | 45,423 | 42,212 | 29,484 | 37,157 | 47,441 | 45,525 |
| 2016 | 508,793 | 38,161 | 33,279 | 33,181 | 31,385 | 55,111 | 43,337 | 53,442 | 44,660 | 31,282 | 56,429 | 43,842 | 44,684 |
| 2017 | 493,690 | 43,947 | 39,019 | 35,655 | 25,462 | 36,867 | 32,184 | 40,560 | 39,962 | 58,798 | 44,544 | 53,543 | 43,149 |
| 2018 | 510,694 | 37,593 | 40,834 | 44,183 | 34,802 | 51,719 | 36,433 | 54,842 | 50,383 | 44,162 | 38,224 | 37,697 | 39,822 |
| 2019 | 550,350 | 38,060 | 48,520 | 35,164 | 46,764 | 46,939 | 36,721 | 59,585 | 49,236 | 42,244 | 43,823 | 50,838 | 52,456 |
| 2020 | 479,922 | 39,710 | 41,761 | 38,743 | 40,451 | 36,148 | 33,202 | 29,394 | 42,176 | 49,225 | 35,982 | 44,857 | 48,273 |
| 2021 | 388,395 | 41,326 | 43,681 | 48,620 | 41,453 | 22,329* | 13,845* | 21,981* | 26,665* | 25,446* | 30,290 | 31,801 | 40,958 |
In May 2021, output was limited to ~75 MW.
See also
References
- ↑ "Agreement announced with Shenhua Group". Hydro Tasmania. 17 November 2014. Archived from the original on 18 December 2014. Retrieved 18 December 2014.
- 1 2 "Wind power". Hydro Tasmania. Archived from the original on 18 December 2014. Retrieved 18 December 2014.
- ↑ McHenry, Mark. "Research Institute for Sustainable Energy". www.see.murdoch.edu.au. Archived from the original on 18 March 2021. Retrieved 1 April 2021.
