This article is about the gross regional product (GRP) of German states. Most figures are from the Federal Statistical Office of Germany; figures from other sources are otherwise referenced.[1] The GRP of German states are shown in Euro (€). For easier comparison as per IMF estimates, all the figures are converted into US$ according to annual average exchange rates.
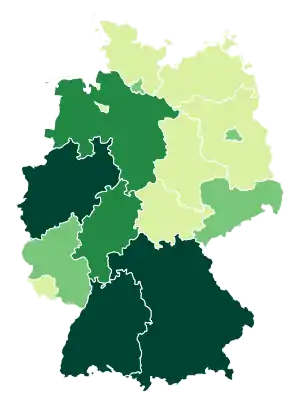
German states by GRP (2018)
€500–800 billion
€200–500 billion
€100–200 billion
€10–100 billion
2022 list
| States | GRP (bil. EUR€) |
GRP nominal (bil. US$) |
% total GDP |
|---|---|---|---|
| Germany | 3,867.050 | 4,075.097 | 100 |
| 793.790 | 836.496 | 20.5 | |
| 716.784 | 755.347 | 18.5 | |
| 572.837 | 603.656 | 14.8 | |
| 339.414 | 357.675 | 8.8 | |
| 323.352 | 340.748 | 8.4 | |
| 179.379 | 189.030 | 4.6 | |
| 171.699 | 180.936 | 4.4 | |
| 146.511 | 154.393 | 3.8 | |
| 144.220 | 151.979 | 3.7 | |
| 112.755 | 118.821 | 2.9 | |
| 88.800 | 93.577 | 2.3 | |
| 75.436 | 79.495 | 2.0 | |
| 71.430 | 75.273 | 1.8 | |
| 53.440 | 56.315 | 1.4 | |
| 38.698 | 40.780 | 1.0 | |
| 38.505 | 40.577 | 1.0 |
See also
- States of Germany
- List of German states by GRP per capita
- List of German cities by GDP
- List of German states by Human Development Index
- List of German states by fertility rate
- List of German states by life expectancy
- List of German states by unemployment rate
- List of German states by household income
- List of German states by exports
References
Notes
- Federal Statistical Office of Germany
- Annual average exchange rates: GDP (in US$), according to UN Countries GDP list
- Annual exchange rates (as of 31 Dec) from OFX:
- 2022: 1 EUR = 1.0538
This article is issued from Wikipedia. The text is licensed under Creative Commons - Attribution - Sharealike. Additional terms may apply for the media files.