
Life Expectancy in Mexico by state in 2017
The following is the list of the States of Mexico by life expectancy Mexico has seen declines in some states due to increasing crime in many Mexican cities, especially Ciudad Juarez.

Development of life expectancy in Mexico according to estimation of the World Bank Group
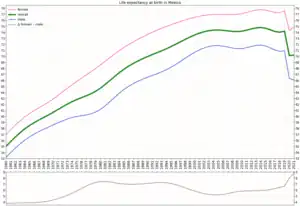
Life expectancy with calculated gender gap

Life expectancy in Mexico according to estimation of the Our World in Data
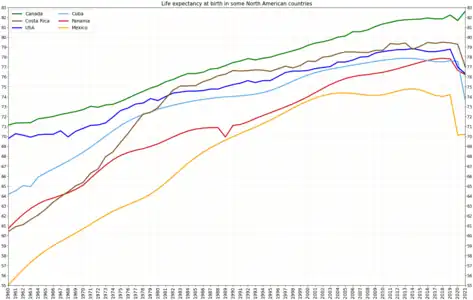
Development of life expectancy in Mexico in comparison to other big countries of North America
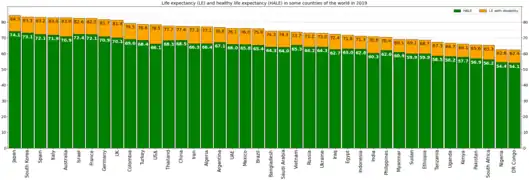
Life expectancy and healthy life expectancy in Mexico on the background of other countries of the world in 2019
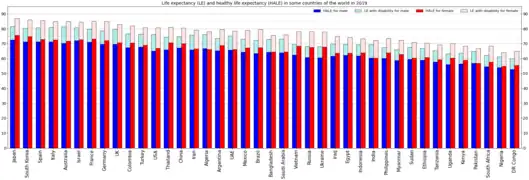
Life expectancy and healthy life expectancy for males and females
The Data in the 2017 and 2010 columns come from the IHME GBD Results tool. Life Expectancy In Mexico saw large increases before 1990 but recent events involving increased drug activity and increased crime within the cities of Mexico. For example, Campeche had a Life Expectancy in 2010 of 76.30 years and it has declined to 75.07 years. This was primarily due to increased cartel activity within the state.
IHME Rankings
- Mexican States by life expectancy (2017)
| Rank | State | Life Expectancy in 2017[1] | Life Expectancy in 2010[1] | Change 2010-2017 | Males[1] | Females[1] |
|---|---|---|---|---|---|---|
| 3. | 77.31 | 76.18 | 74.86 | 79.70 | ||
| 21. | 75.17 | 73.51 | 71.67 | 79.07 | ||
| 9. | 76.81 | 75.72 | 74.12 | 79.87 | ||
| 23. | 75.07 | 76.30 | 72.71 | 77.49 | ||
| 30. | 74.28 | 74.24 | 72.28 | 76.23 | ||
| 32. | 73.11 | 68.58 | 70.11 | 76.27 | ||
| 16. | 75.52 | 74.59 | 73.37 | 77.73 | ||
| 19. | 75.37 | 75.55 | 72.33 | 78.59 | ||
| 7. | 76.92 | 73.50 | 74.33 | 79.59 | ||
| 14. | 76.21 | 76.48 | 73.30 | 79.05 | ||
| 17. | 75.44 | 75.04 | 71.12 | 79.86 | ||
| 2. | 77.43 | 76.71 | 74.59 | 80.22 | ||
| 18. | 75.40 | 75.63 | 72.54 | 78.29 | ||
| - | 75.52 | 75.23 | 72.26 | 78.50 | ||
| 20. | 75.20 | 75.64 | 71.52 | 78.74 | ||
| 22. | 75.14 | 75.54 | 72.12 | 78.14 | ||
| 10. | 76.62 | 75.76 | 73.35 | 79.87 | ||
| 26. | 74.78 | 76.12 | 71.51 | 77.99 | ||
| 5. | 77.16 | 75.99 | 74.38 | 80.14 | ||
| 4. | 77.17 | 75.86 | 74.95 | 79.76 | ||
| 15. | 75.92 | 75.80 | 72.92 | 78.75 | ||
| 31. | 74.13 | 74.87 | 71.05 | 77.06 | ||
| 13. | 76.25 | 76.34 | 73.29 | 79.18 | ||
| 28. | 74.46 | 75.44 | 72.25 | 76.88 | ||
| 6. | 77.09 | 76.58 | 74.41 | 79.76 | ||
| 1. | 78.27 | 75.04 | 75.18 | 81.53 | ||
| 27. | 74.69 | 74.10 | 71.51 | 78.18 | ||
| 29. | 74.43 | 74.81 | 71.50 | 77.42 | ||
| 11. | 76.56 | 75.25 | 73.67 | 79.52 | ||
| 12. | 76.32 | 76.56 | 73.72 | 78.82 | ||
| 25. | 75.02 | 75.40 | 72.25 | 77.73 | ||
| 24. | 75.06 | 75.77 | 72.73 | 77.41 | ||
| 8. | 76.88 | 76.52 | 74.34 | 79.45 |
Past Life Expectancy
| State | 2017[1] | 2010[1] | 2000[1] | 1990[1] | Change 1990-2017 |
|---|---|---|---|---|---|
| 75.52 | 75.23 | 74.59 | 71.40 | ||
| 77.31 | 76.18 | 75.30 | 72.82 | ||
| 75.17 | 73.51 | 71.40 | 70.04 | ||
| 76.81 | 75.72 | 75.17 | 73.68 | ||
| 75.07 | 76.30 | 75.86 | 72.27 | ||
| 74.28 | 74.24 | 73.06 | 70.17 | ||
| 73.11 | 68.58 | 71.79 | 69.21 | ||
| 75.52 | 74.49 | 74.08 | 71.40 | ||
| 75.37 | 75.55 | 74.96 | 70.66 | ||
| 76.92 | 73.50 | 75.83 | 71.69 | ||
| 76.21 | 76.48 | 75.05 | 71.74 | ||
| 75.44 | 75.04 | 76.08 | 72.44 | ||
| 77.43 | 76.71 | 76.22 | 71.71 | ||
| 75.40 | 75.63 | 74.45 | 71.49 | ||
| 75.20 | 75.64 | 74.89 | 72.53 | ||
| 75.14 | 75.54 | 74.04 | 70.29 | ||
| 76.62 | 75.76 | 75.34 | 72.41 | ||
| 74.78 | 76.12 | 75.75 | 72.19 | ||
| 77.16 | 75.99 | 76.56 | 72.15 | ||
| 77.17 | 75.86 | 75.54 | 73.12 | ||
| 75.92 | 75.80 | 74.47 | 69.39 | ||
| 74.13 | 74.87 | 73.37 | 69.43 | ||
| 76.25 | 76.34 | 74.40 | 71.36 | ||
| 74.46 | 75.44 | 75.41 | 73.42 | ||
| 77.09 | 76.58 | 76.23 | 72.92 | ||
| 78.27 | 75.04 | 76.06 | 73.24 | ||
| 74.69 | 74.10 | 73.57 | 71.23 | ||
| 74.43 | 74.81 | 74.87 | 71.86 | ||
| 76.56 | 75.25 | 75.40 | 72.69 | ||
| 76.32 | 76.56 | 75.47 | 72.09 | ||
| 75.02 | 75.40 | 74.74 | 71.49 | ||
| 75.06 | 75.77 | 75.22 | 72.29 | ||
| 76.88 | 76.52 | 76.40 | 73.78 |
See also
Wikimedia Commons has media related to Life expectancy charts for Mexico.
References
This article is issued from Wikipedia. The text is licensed under Creative Commons - Attribution - Sharealike. Additional terms may apply for the media files.