.svg.png.webp)
Map of the South African provinces by Human Development Index in 2017.
Legend:
Legend:
0.700 – 0.799 (high)
0.600 – 0.699 (medium)
This is a list of the provinces of South Africa by Human Development Index as of 2021.[1]
| Rank | Province | HDI (2021) |
|---|---|---|
| High human development | ||
| 1 | Western Cape | |
| 2 | Gauteng | |
| 3 | Free State | |
| – | ||
| 4 | Limpopo | |
| 5 | KwaZulu-Natal | |
| 6 | Northern Cape | |
| Medium human development | ||
| 7 | Mpumalanga | |
| 8 | North West | |
| 9 | Eastern Cape | |
Historical data[2]
| Province | 1990 | 1995 | 2000 | 2005 | 2010 | 2015 | 2020 |
|---|---|---|---|---|---|---|---|
| Western Cape | 0.711 | 0.745 | 0.705 | 0.689 | 0.717 | 0.753 | 0.766 |
| Gauteng | 0.696 | 0.729 | 0.692 | 0.681 | 0.714 | 0.741 | 0.750 |
| Free State | 0.648 | 0.677 | 0.646 | 0.637 | 0.672 | 0.714 | 0.726 |
| Limpopo | 0.598 | 0.623 | 0.604 | 0.612 | 0.663 | 0.715 | 0.727 |
| KwaZulu-Natal | 0.589 | 0.615 | 0.594 | 0.604 | 0.656 | 0.710 | 0.724 |
| Northern Cape | 0.625 | 0.654 | 0.624 | 0.618 | 0.655 | 0.702 | 0.715 |
| Mpumalanga | 0.609 | 0.635 | 0.610 | 0.608 | 0.649 | 0.683 | 0.692 |
| North West | 0.626 | 0.654 | 0.624 | 0.615 | 0.648 | 0.681 | 0.690 |
| Eastern Cape | 0.581 | 0.606 | 0.583 | 0.586 | 0.631 | 0.677 | 0.688 |
| South Africa | 0.632 | 0.661 | 0.633 | 0.632 | 0.675 | 0.716 | 0.727 |
References
- ↑ "Sub-national HDI - Area Database - Global Data Lab". hdi.globaldatalab.org.
- ↑ "Sub-national HDI - Area Database - Global Data Lab". hdi.globaldatalab.org.
| Ranked | 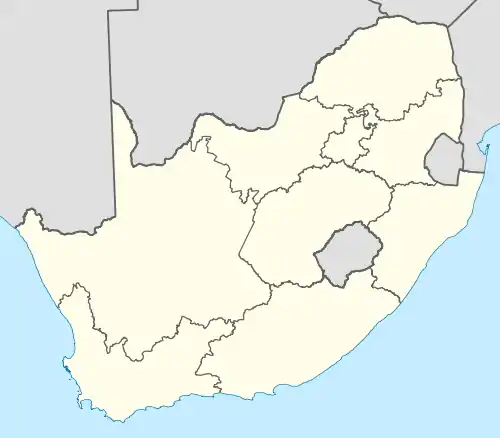 | |
|---|---|---|
| Political | ||
| Other | ||
| By province | Flag of South Africa | |
|---|---|---|
| Natural resources | ||
| Industry | ||
| Services | ||
| Economic history | ||
| Affirmative action | ||
| Macroeconomics | ||
| Misc. | ||
This article is issued from Wikipedia. The text is licensed under Creative Commons - Attribution - Sharealike. Additional terms may apply for the media files.